StatChat

Low-wage workers are more diverse than you think

In his 2014 State of the Union address, President Obama called on Congress to “give American a raise” by increasing the federal minimum wage. For the second year in a row he argued “that in the wealthiest nation on earth, no one who works full time should have to live in poverty”. Even with the […]

Virginia is getting older

Like many people, I’ve been inclined to explain Virginia’s decades of explosive population growth in terms of migration and the Federal government’s expansion in Northern Virginia.  While that’s certainly part of the equation, “natural increase” has actually driven most of the growth, just as it has across the country.  Natural increase simply means more people […]

“Seeing” Virginia’s Workforce

When it comes to interactive data visualizations, I am a junky. I don’t mean the dime-a-dozen country maps showing the favorite baby name/band/movie/current fad for each state. I mean the kind that present information in a way that surprises me, even when I am relatively familiar with the data […]

Average Density of Virginia’s Metro Areas

Recently, I’ve been comparing a number of traits of metropolitan areas based on distance from the core.  Here I’m looking at the average densities of each metro area as you travel outwards from the center, calculated using census blocks and 2010 short-form census data.  I’ve graphed them in groups of three.  Cities with a strong […]

What, exactly, do Americans do all day?

Last week, the Bureau of Labor Statistics released results from the 2013 American Time Use Survey. This survey, administered every year for the last decade, asks respondents–selected from people who have recently completed the Current Population Survey–to keep a diary of how they spent their time for a full 24 hour period. These data allow us to understand something about […]

The Line that Divides DC

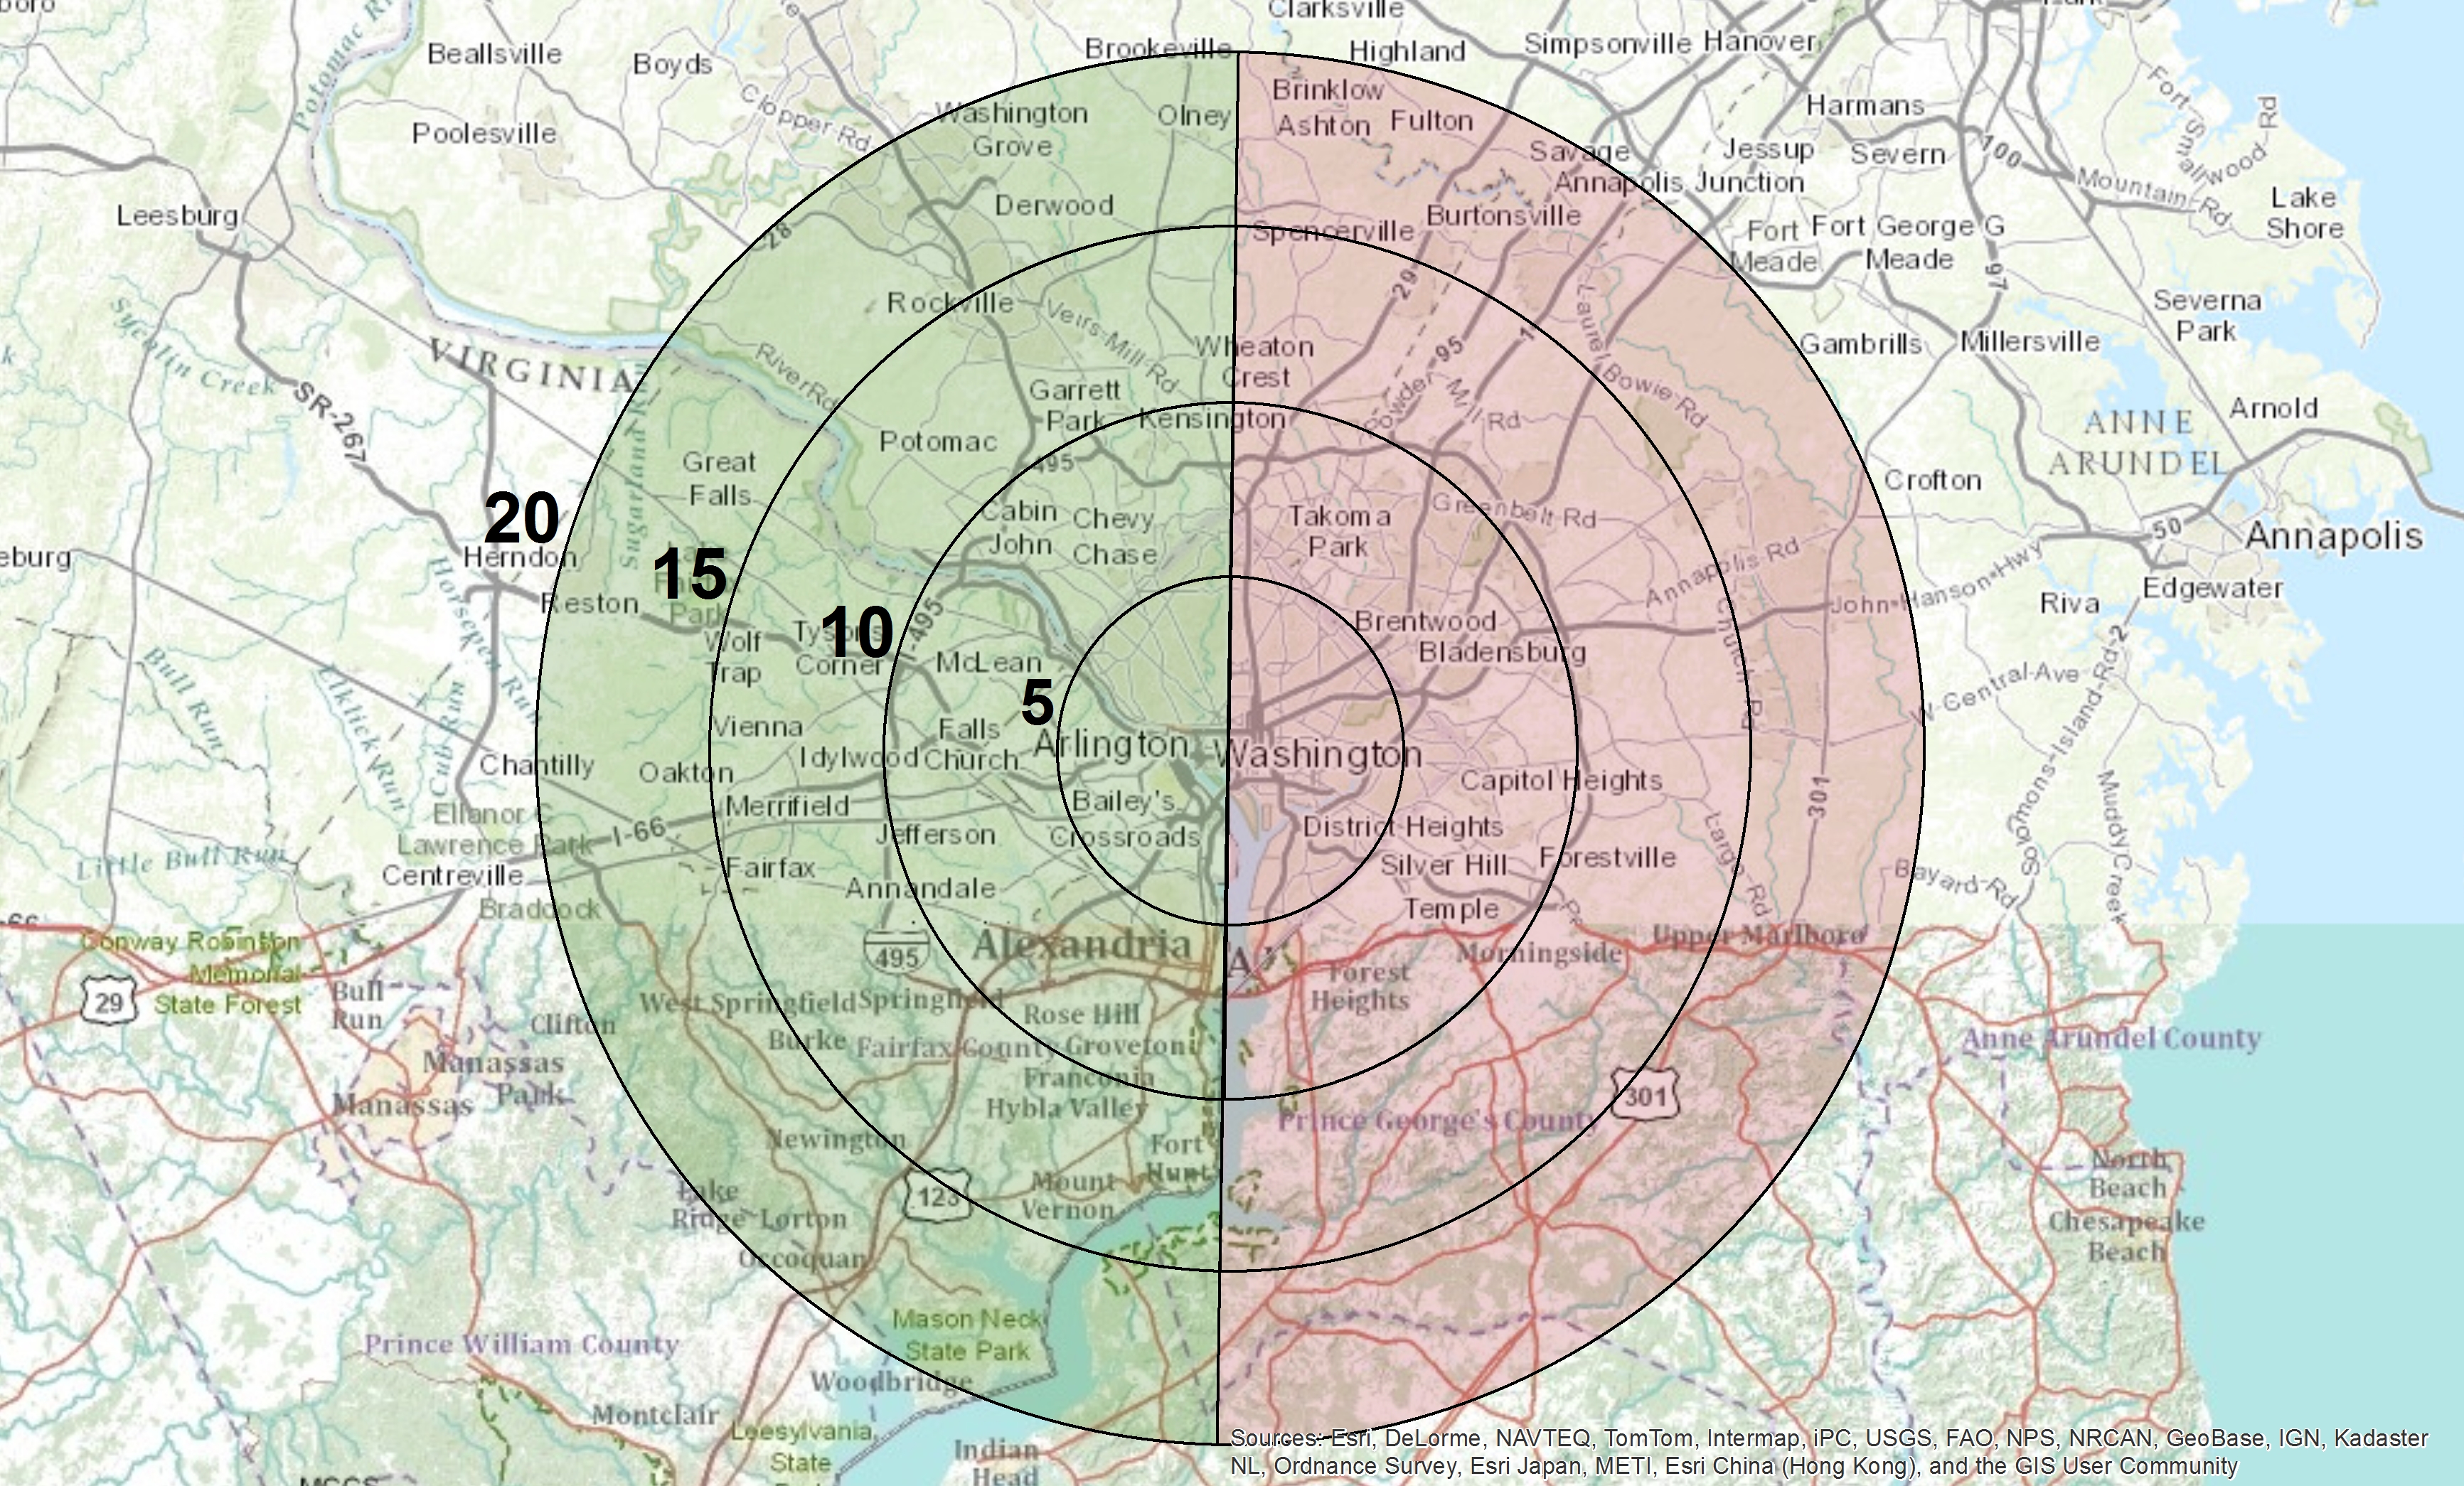
No it’s not a party line.  It’s an almost perfectly straight line running north-south along 16th Street, passing through the White House, and then continuing along the Potomac River to the south.  It divides two very different sides of the DC area.These graphs are a cross-section of the DC area that looks at how the […]

What’s Driving the Rise in High School Graduation Rates?

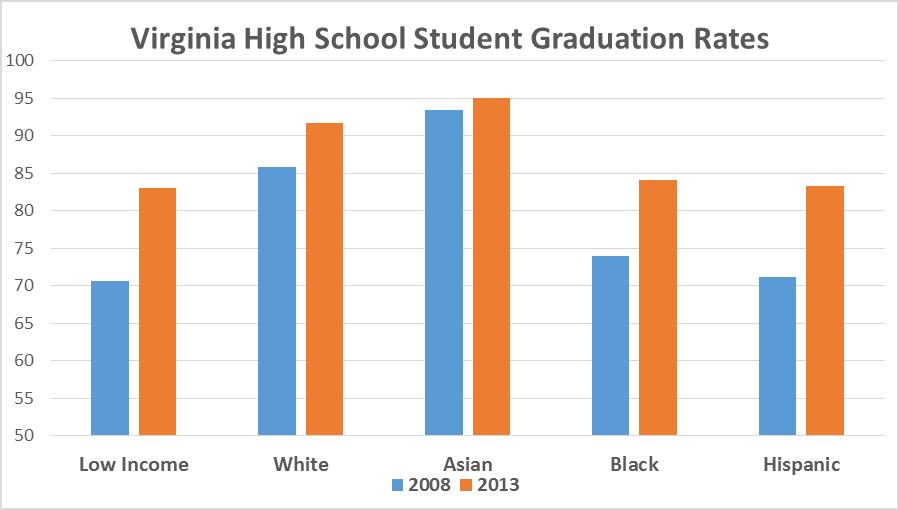
Much of the news that circulates regarding the state of education is not positive, but one trend that remains under-reported is the significant rise in public high school graduation rates during the past decade. By the end of this month, around 85,000 high school seniors are expected to have graduated from Virginia’s public schools.That is […]

Extended Families: Weapon against Child Poverty?

Children living in married parent families are less likely to live in or near poverty than children in unmarried (either single– or cohabiting) parent families. Some policy advocacy groups use this to argue that marriage is the “greatest weapon against child poverty” because of the additional economic and human capital marriage adds to a household, even […]

Metropolitan Cross-Sections: College Graduates

With input from Hamilton, I’ve been looking recently at how metropolitan areas change as one travels from the center to the periphery.  The following charts show the percent of the population 25 and older with bachelor’s degrees.  The graphs are based on concentric rings coming out from the center of downtown.  I’ve included reference maps […]

Children living with married parents can be poor, too

Drawing on our recent report, New Insights on Childhood Poverty, Annie and I published an op-ed in the Richmond Times-Dispatch over the weekend. In it we discussed the consequences of limiting the conversation about childhood poverty to children with single parents: …focusing the conversation about childhood poverty exclusively on children of single parents renders invisible […]