How do we know whether development pays for itself?
Local governments across the country have come under increasing fiscal strain in recent years, with several being forced to declare bankruptcy. The problems range from pension programs and decaying infrastructure to falling revenues from industrial and sales taxes as manufacturing gets offshored and shopping happens online. In Virginia, cities are further constrained by annexation laws that prevent them from expanding with their metropolitan area and gaining revenue from greenfield development or wealthier suburbs.
Meanwhile, the high mobility of Americans and increasing specialization of metro areas and cities have forced localities to behave like competitors in a market for residents and businesses, rather than as simple political entities administering a group of people. This makes it more important than ever for localities to understand which investments and spatial configurations create value and which don’t. The immediate problem is that we lack good ways of approaching the question.
Property value per acre is a good start on the revenue side. Not only is it influenced by different types of public investments that people want to be near, it’s also heavily influenced by local land use law – namely, how many people are allowed to live on a piece of land. The assessed value, which is mapped here, determines how much revenue the locality generates via property tax. That’s important because many of the costs cities have to bear are determined primarily by the amount of land they have to cover (see chart below). That means that if land is not generating enough tax value per acre, some municipal services will be subsidized by other neighborhoods. Others will simply have to be less comprehensive. For instance, fire department and emergency response times are much longer in low-density areas, simply because people are farther away from stations.
Per Capita Expenditures (vary primarily by number of peopled that must be served) | Per Area Expenditures (vary primarily by amount of area that must be serviced) | |
|
|
Charlottesville and Albemarle County
These maps show the assessed value of property on a per-acre basis. That value will be a combination of how willing people are to live or put businesses on a property, combined with how many people are allowed to live there (or how much business space is allowed).
I’ve mapped the parcels individually, but I’ve also created a heat map that gives a more accurate picture of the average value in each area.
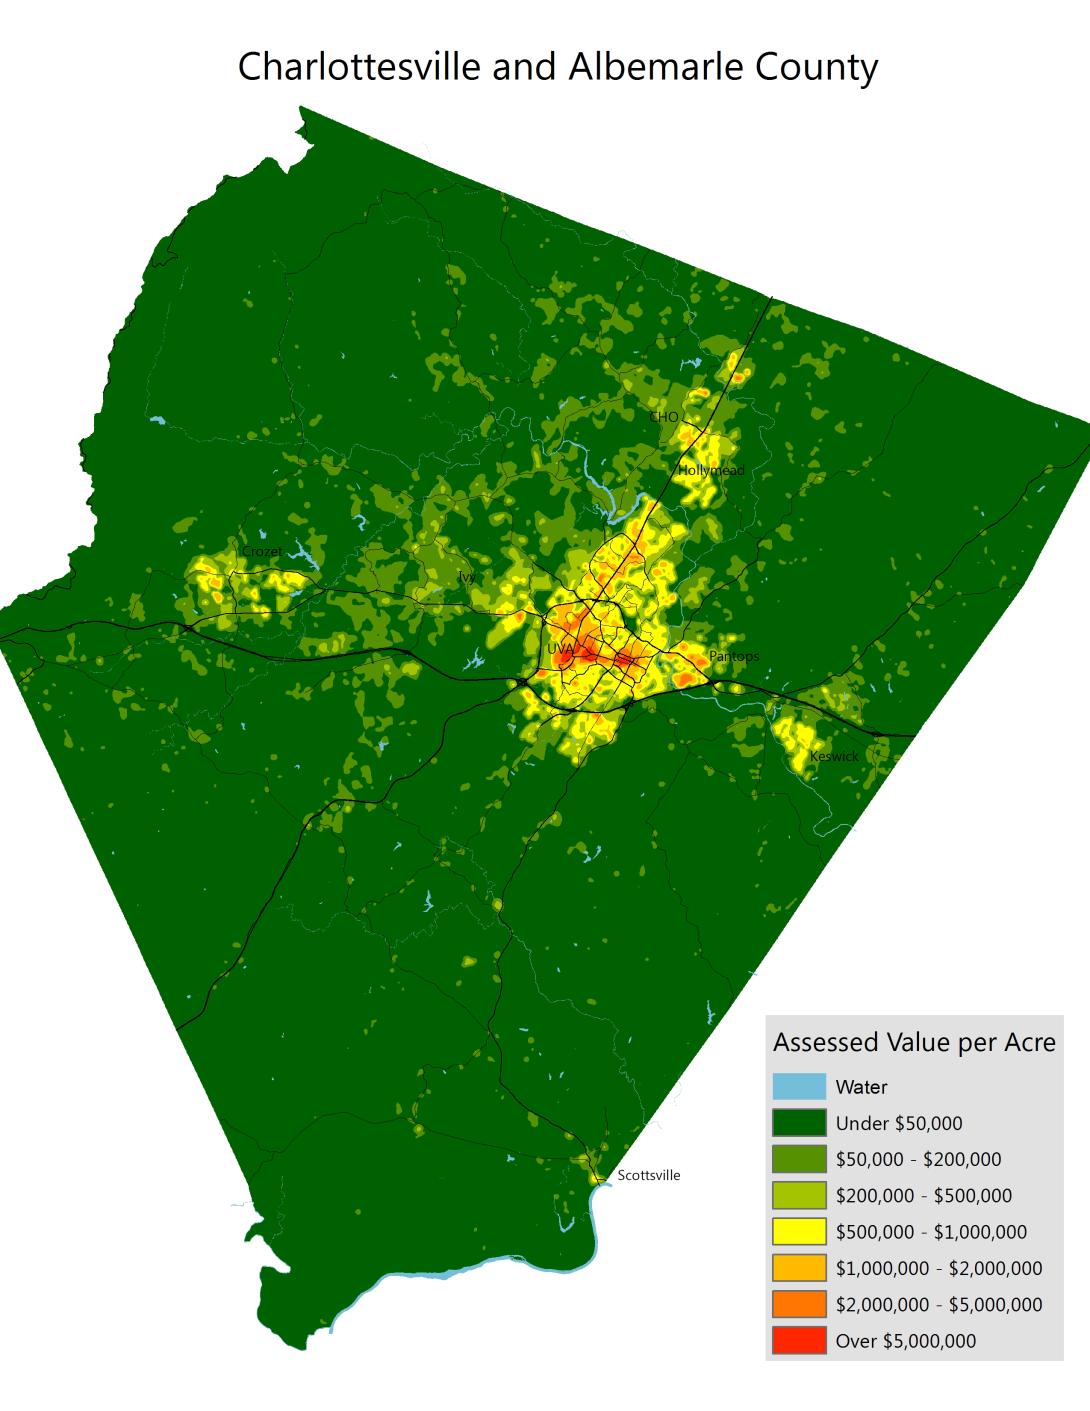
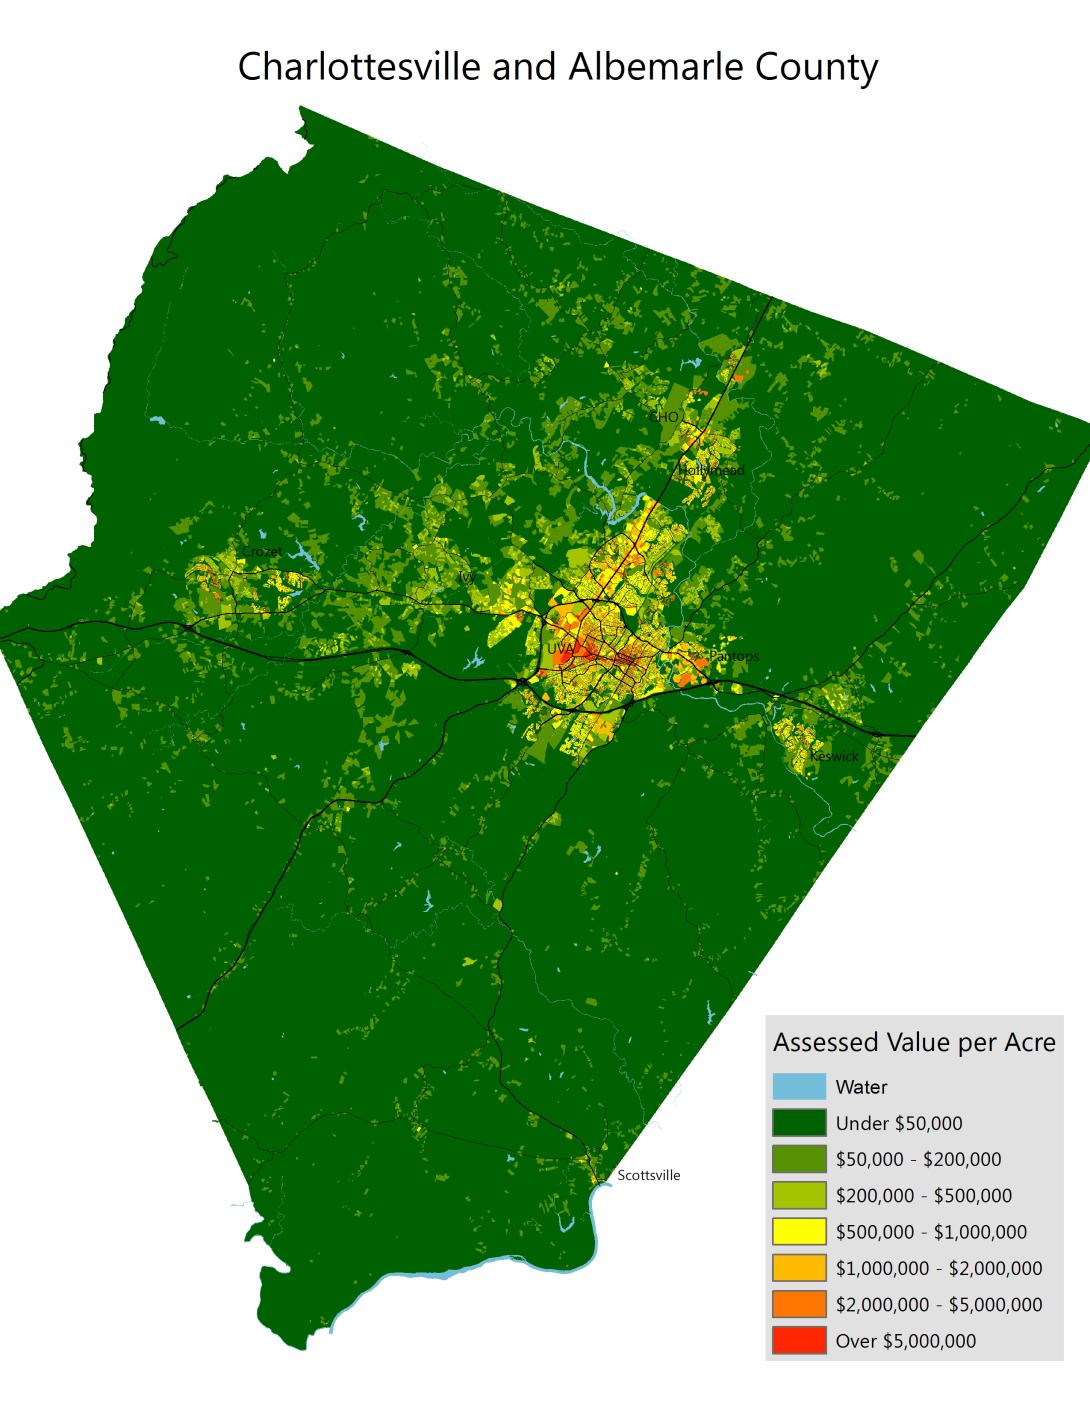
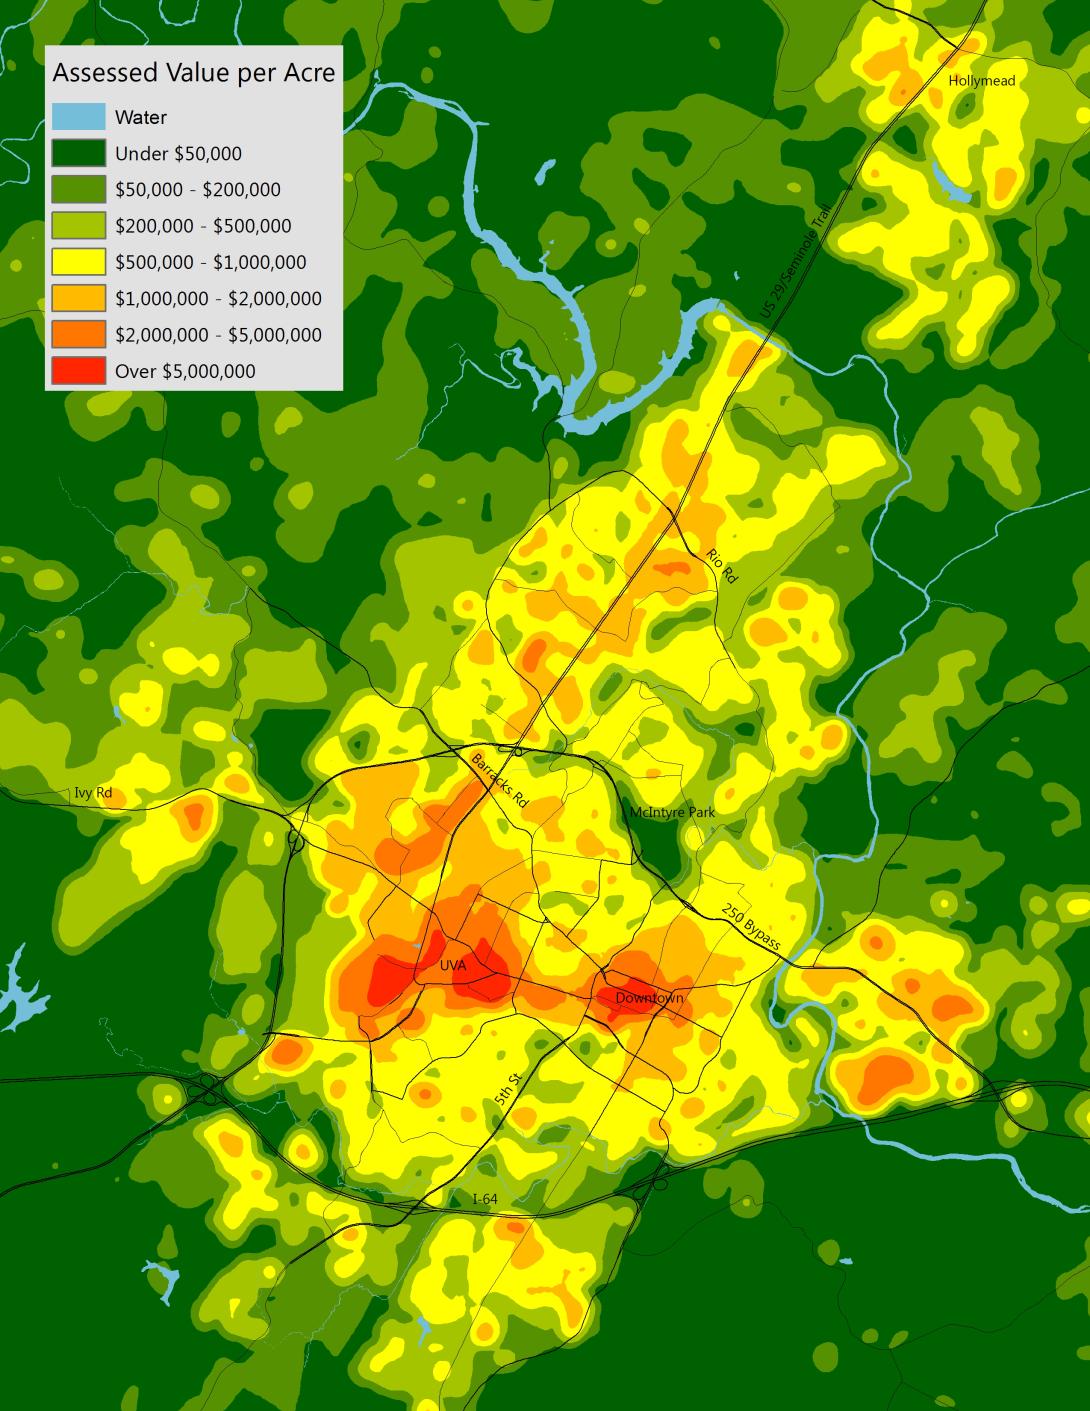
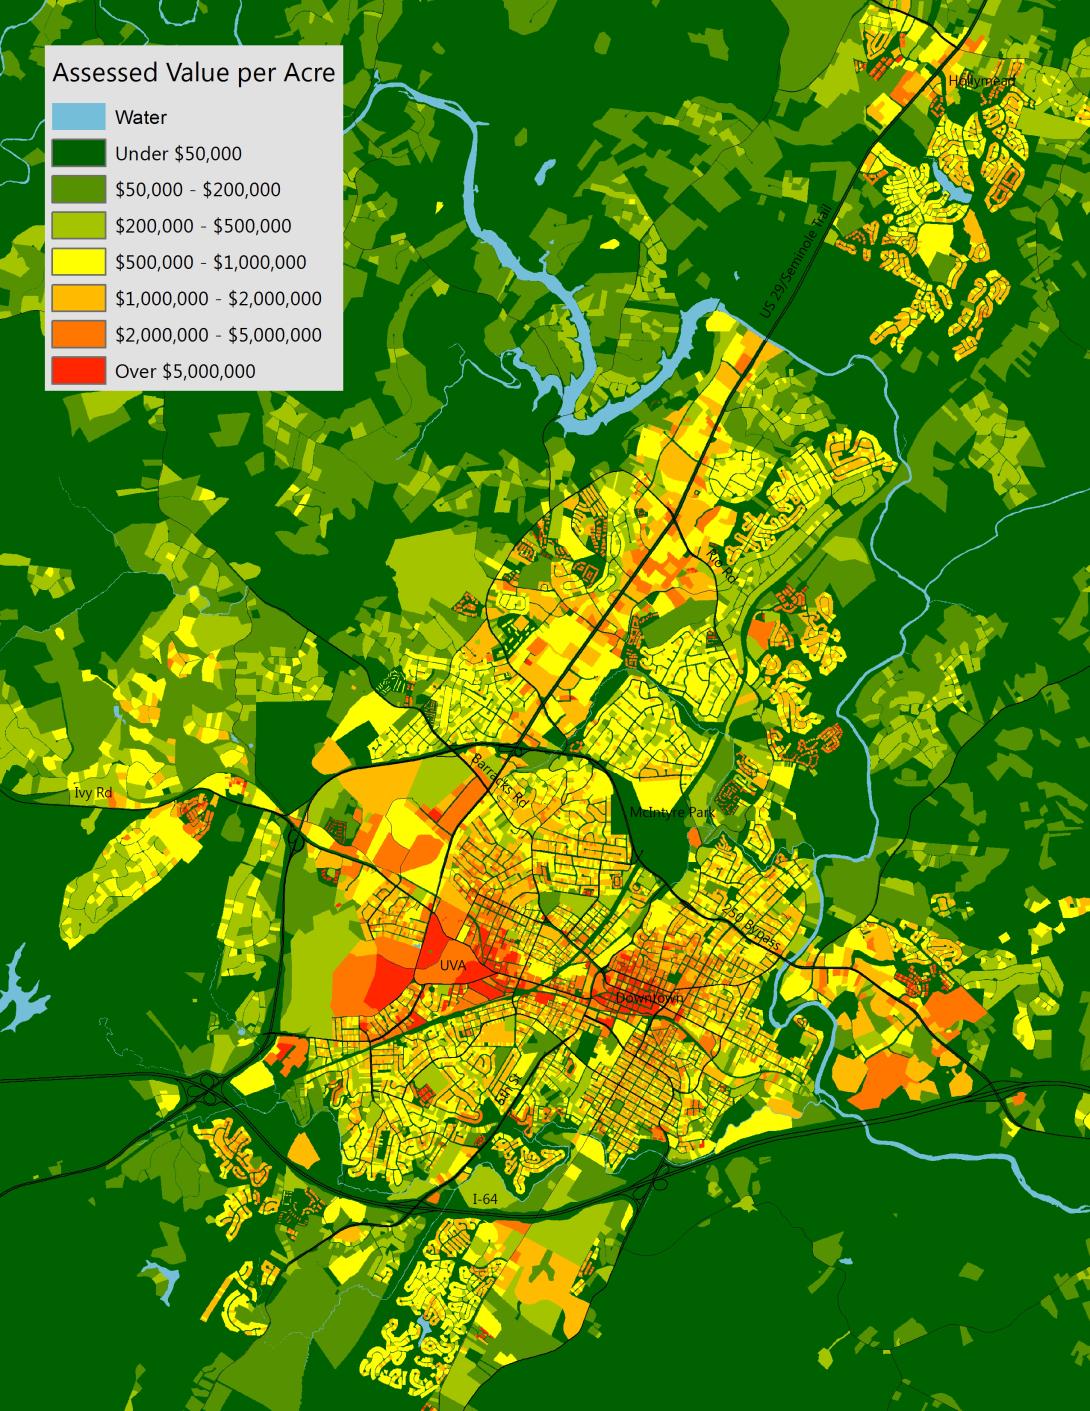
As expected, the most valuable property is concentrated around UVA and downtown Charlottesville. Since most of UVA (including its hospital) is not taxed, the highest revenues for the city are generated downtown and in the dense neighborhoods around the Corner. In order to create that value, the city has to invest quite a bit in downtown through everything from brick pavers and parking garages to extra police patrols. But the high value created justifies the expense. In the city’s eyes, the attractiveness of the Downtown Mall is also an amenity that creates value across the city and county.
To give a better sense of scale, I’ve mapped the same data in 3-dimensions. The smaller peaks surrounding them are other areas of the city and the little trail of hills coming out is the US-29 corridor. Crozet can be seen in the distance.
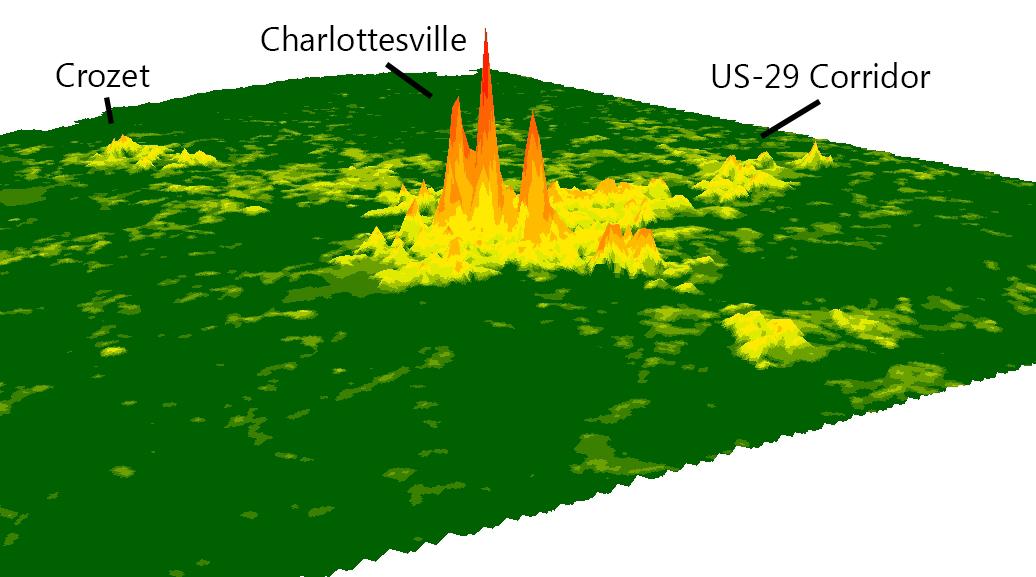
It’s difficult to evaluate just how worthwhile these investments are from a fiscal perspective, but getting a better idea of the revenues and expenditures per acre can help us get there.
Density and the Market for Space
Value per acre is interesting to map because it often runs counter to our assumptions about rent or the cost of homes. Many areas with high land values also have relatively low rents. Others with very high home values and rents have very low land values. The key logical link is how much density is permitted relative to how much is in demand. People will always prefer to have more space, but they won’t necessarily pay in proportion to what that space is worth. Imagine two houses with small yards that fit onto the same amount of space as an identical house with a large yard. Each of the small-lot houses might rent for $1,000 while the large lot house rents for $1,300. Our perception is that the land is more valuable in that area because rent is $300 higher, when actually the land is worth $700 less.
In theory, people will concentrate into dense areas near desirable locations until they decide that space is valuable enough to pay for or move further away for. Zoning regulations, particularly limitations on the number of dwelling units that may be built in an area, force people to live farther from their preferred location, pushing people further out. This in turn makes land more valuable across a wider area, but also requires the locality to service a larger area and allow development or deal with housing shortages.
So… how do we know if a development pattern pays for itself? What we need is “spatial accounting” – a new approach to planning and budgeting that will bring the two in line with each other. I’m thrilled to see the sharp minds over at Strong Towns made some similar points in an article published today. There are inevitably mismatches in how much money residents pay in property tax and what level of service they receive from the locality. But a better understanding of the relationship between the two will help cities and counties make decisions that are better for everyone.


