


Older Virginians by Region
According to the United Nations, a society is classified as an “aging society” when more than 10% of its population is aged 60 and older. The 2020 Census reported that approximately 1 in 5 Virginians (22.6%) were aged 60 and older, placing Virginia in the “aging society” category. When Northern Virginia was excluded, that number increased to 25%, implying regional disparities in the distribution of older adults. This blog post examines the demographics of Virginians aged 60 and older across eight regions in the Commonwealth, offering a regional perspective on the needs of this rapidly growing population.
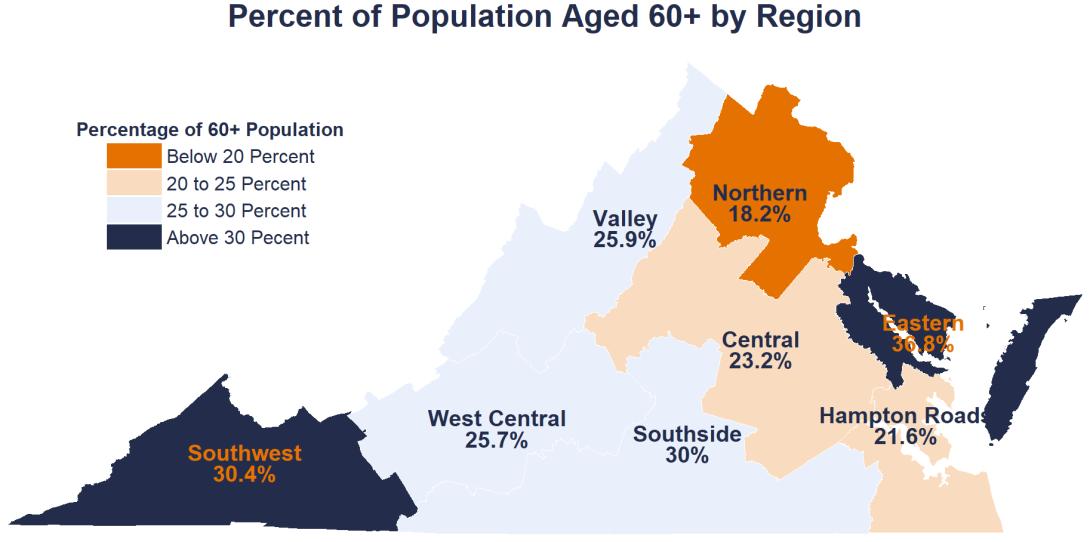
Geographic Concentration
Northern Virginia had the lowest percentage of the population aged 60 or older (18.2%), followed by Hampton Roads (21.6%), and Central Virginia (23.2%). In contrast, rural regions such as the Southwest, Southside, and Eastern Shore had higher concentrations of older adults—all over 30%.
- Number of Population Aged 60+ by Region
Eastern
Southwest
Southside
Valley
West Central
Central
Hampton Roads
Northern
45,540
112,815
122,010
132,790
195,065
380,950
373,270
562,020
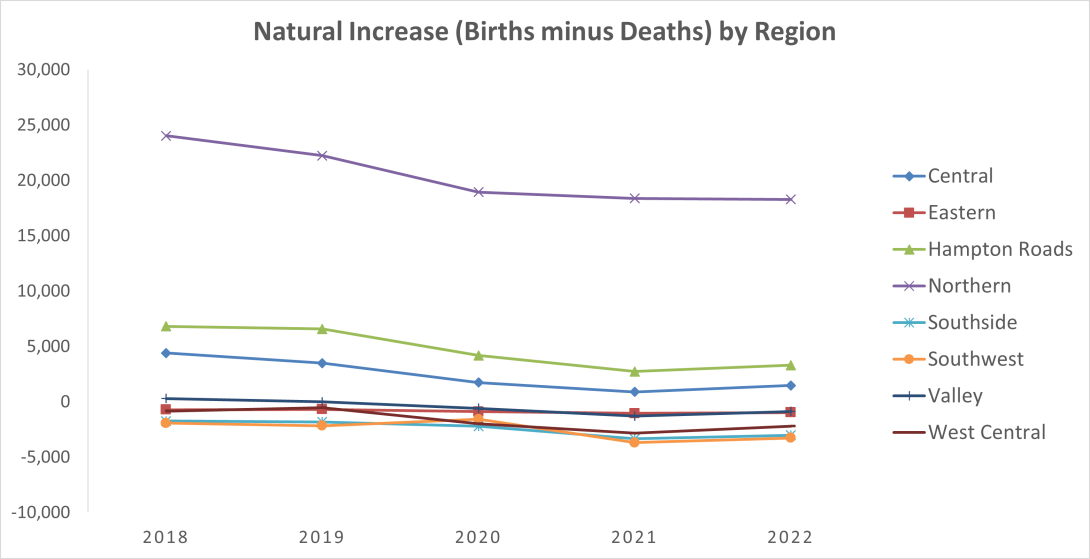
Population aging is primarily driven by low birth rates. Natural increase (births minus deaths) has declined across all regions in Virginia, but more dramatically in the Southwest, Southside, Eastern Shore, and West Central where deaths have outpaced births since 2018.
The Oldest Old
The distribution of the "oldest old" (those aged 85+) reveals unique regional challenges. While 1.8% of the total Virginians were population aged 85 and above, the Eastern Shore recorded the highest share—3.2% of its total population. Despite small percentages, areas with higher concentrations of this age group may require more long-term care facilities and specialized healthcare services in the future.
Percent and Number of Population Aged 85+ by Region
Eastern | Southside | Valley | West Central | Southwest | Central | Hampton Roads | Northern |
3.2% | 2.6% | 2.4% | 2.3% | 2.3% | 1.8% | 1.6% | 1.3% |
3,970 | 10,580 | 12,530 | 17,670 | 8,705 | 30,195 | 28,115 | 39,550 |
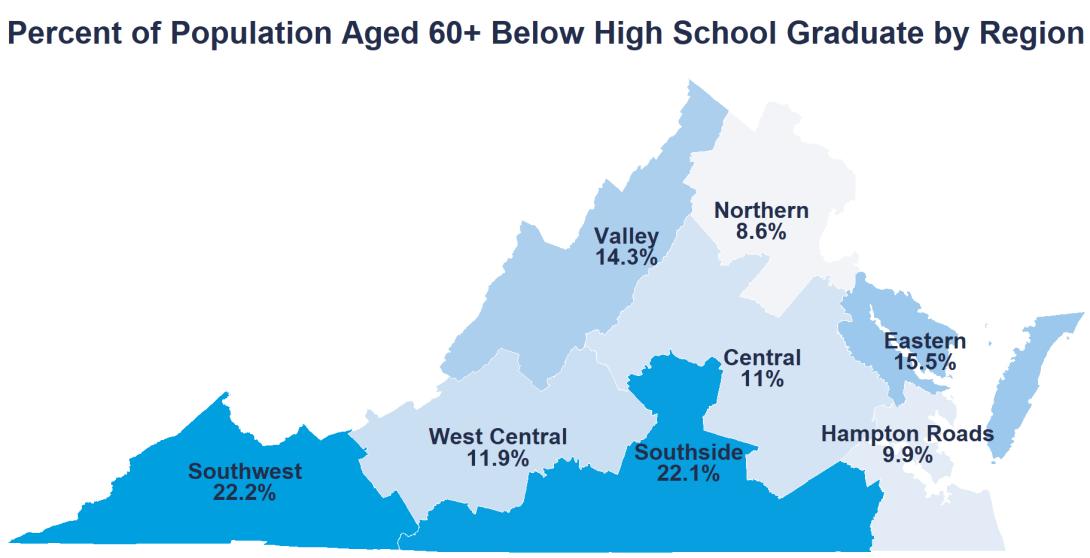
Educational Attainment
Education serves as a proxy for lifetime socioeconomic advantages or disadvantages, impacting economic well-being, health, and access to resources over time. Southwest (22.2%) and Southside (22.1%) had the highest rates of older adults with less than a high school education, compared to Virginia’s statewide rate of 11.9%.
- Number of Population Aged 60+ Below High School Graduate by Region
Southwest
Southside
Eastern
Valley
West Central
Central
Hampton Roads
Northern
25,010
26,975
7,064
18,940
23,175
42,075
37,071
48,110
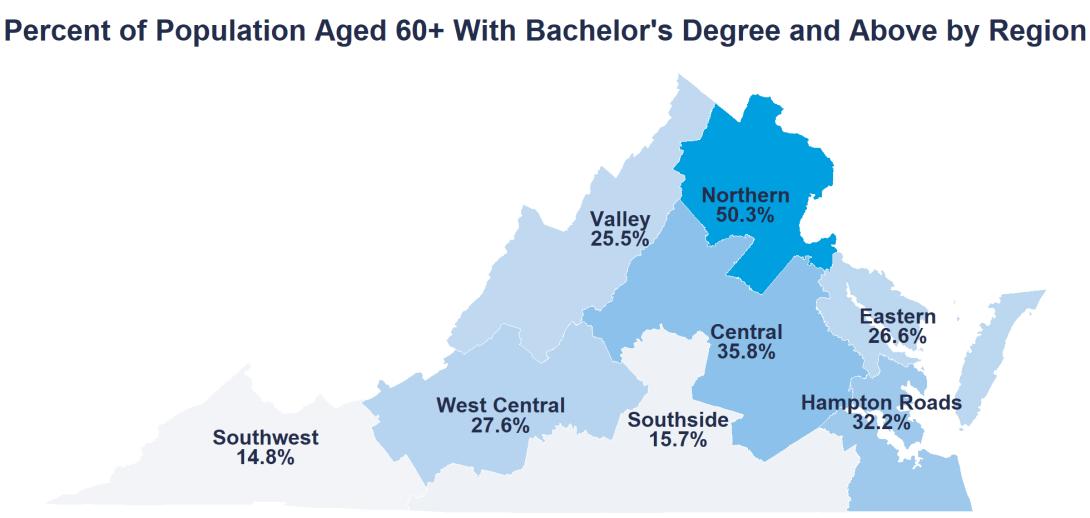
On the other end of the spectrum, more than half of older adults in Northern Virginia had bachelor’s degrees and above (50.3%), compared to the state average of 35%.
- Number of Population Aged 60+ with Bachelor's Degree and Above by Region
Northern
Central
Hampton Roads
West Central
Eastern
Valley
Southside
Southwest
282,629
136,369
120,090
53,910
12,095
33,889
19,137
16,643
Lower educational attainment is often associated with a lifetime of limited economic opportunity, leading to lower-paying jobs, fewer benefits, and less retirement savings. This translates to greater risks in older age, such as financial insecurity, restricted healthcare access, and challenges in managing chronic conditions.
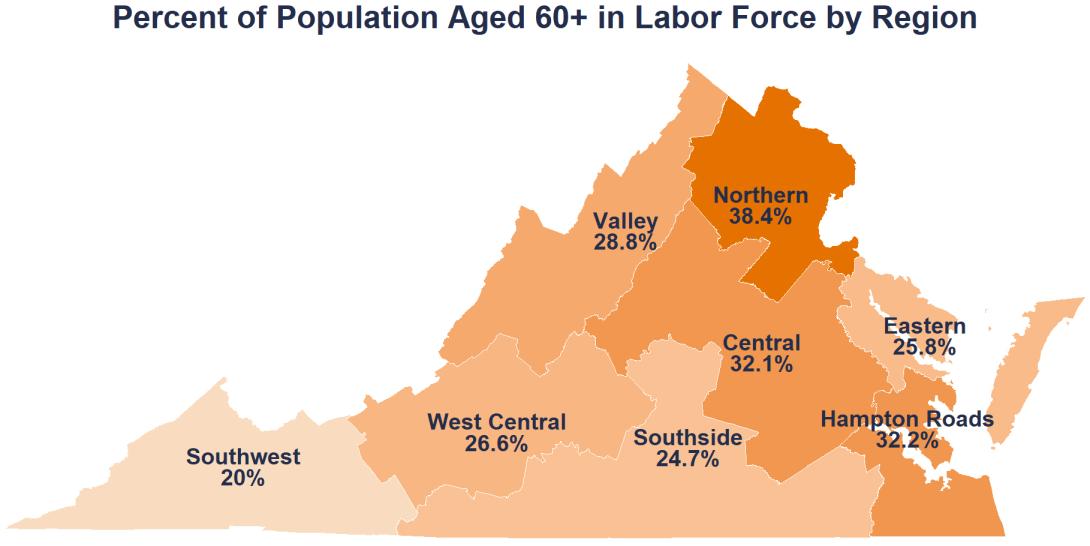
Labor Force Participation
In Virginia, nearly one-third (31.9%) of the 60+ population was still in the labor force, either employed or still actively looking for jobs. Labor force participation among older adults also varied by region. For example, close to 40 percent of older adults in Northern Virginia remained in the labor force.
- Number of Population Aged 60+ in Labor Force by Region
Northern
Hampton Roads
Central
Valley
West Central
Eastern
Southside
Southwest
215,835
120,330
122,345
38,275
51,790
11,740
30,095
22,585
Living Alone
In Virginia, about a quarter of the population aged 60 and older lived alone. While living alone can be a personal choice or preference, it is often used as a proxy measure for social isolation. Older adults who are socially isolated can be more susceptible to physical, cognitive, and mental health issues and may not be aware of or seek the required services. Regionally, older adults in Southside had the highest percentage of older adults living alone (28.1%), whereas Northern Virginia recorded the lowest percentage (20.2%).
Percent and Number of Population Aged 60+ Living Alone by Region
Southside | Eastern | Southwest | West Central | Valley | Central | Hampton Roads | Northern |
28.1% | 26.8% | 26.4% | 26% | 25.4% | 25.2% | 24.8% | 20.2% |
34,310 | 12,185 | 29,740 | 50,790 | 33,770 | 96,180 | 92,410 | 113,635 |
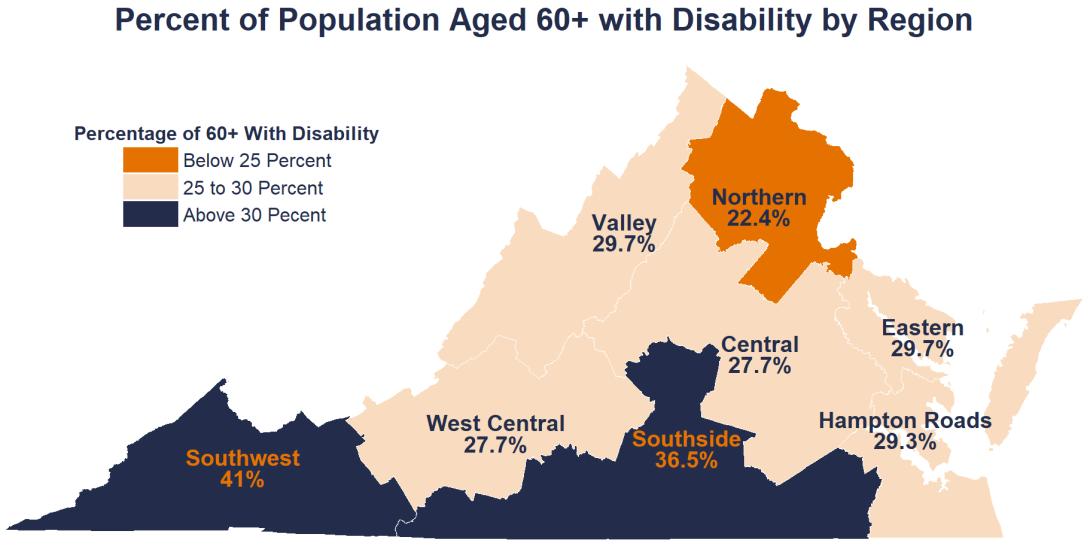
Disability
The prevalence of disabilities among older adults is another area of regional disparity. Based on self-reported responses, Southwest had the highest rate of older adults with a disability (41%), followed by Southside (36.5%). These two regions also had the highest rates of older adults with multiple disabilities (Southwest 23.7% and Southside 19.3%), who require more complex care needs. Regions with higher disability rates will likely have to provide specialized personal care services, transportation assistance, and community health programs.
- Number of Population Aged 60+ with Disability by Region
Southwest
Southside
Valley
Eastern
Hampton Roads
Central
West Central
Northern
45,125
42,765
38,570
13,240
107,495
103,550
52,440
124,485
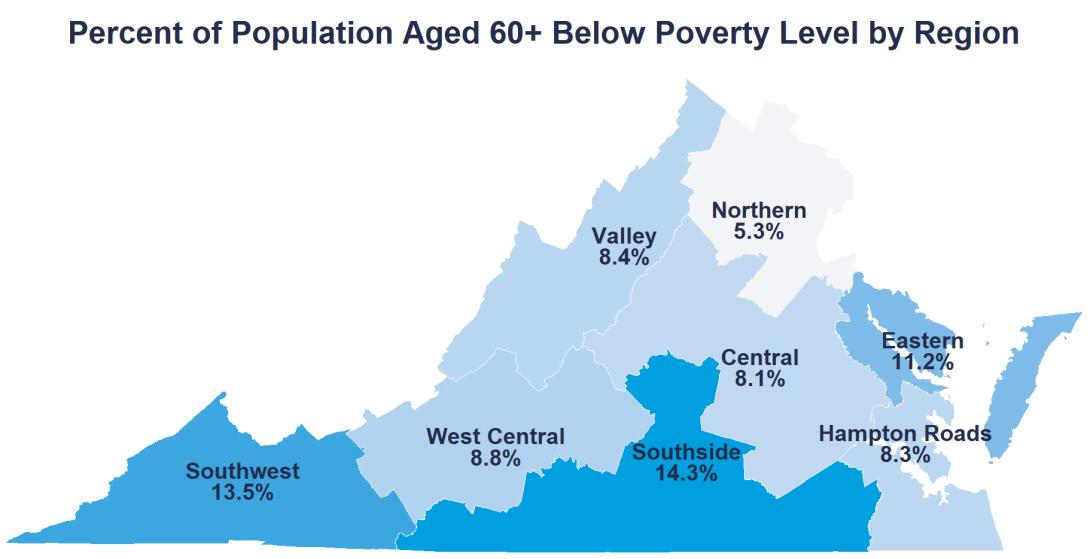
Poverty
In Virginia, 8.2% of the population aged 60 and older were below the poverty level and 7.6% reported participating in food assistance programs, such as SNAP. Regionally, Southwest, Southside, and Eastern Shore showed higher rates of older adults living below the poverty level . Older adults may experience poverty due to a combination of factors, including limited retirement income, rising healthcare costs, age-related barriers to employment, and inadequate access to affordable housing and support services. These reflect broader systemic issues that call for responsive policy solutions.
- Number of Population Aged 60+ Below Poverty Level by Region
Southside
Southwest
Eastern
West Central
Valley
Hampton Roads
Central
Northern
16,760
14,880
5,015
16,685
10,930
30,540
30,225
29,555
Conclusion
Virginia’s aging population experiences vary by region. Regions like Southwest, Southside, and Eastern Shore are dealing with a higher share of older adults in poverty, living alone, and/or with disabilities, making it harder for older adults to live independently and stay healthy. In contrast, regions like Northern, Central, and Hampton Roads have a higher percentage of older adults still in the labor force and with higher educational attainment, which helps the aging population remain active and financially secure. Understanding these regional disparities can help to inform targeted policies and programs in areas such as healthcare, housing, transportation, personal care, and social engagement. It is also critical that older Virginians across all regions have access to essential resources and support systems.
_____________________________________
About the Data
The principal data source comes from the U.S. Census Bureau’s 2018-2022 American Community Survey Special Tabulations provided by the U.S. Administration for Community Living. The ACS 5-year estimates are “period estimates”, representing the characteristics of the population over five years. For more data, please refer to the Data Dashboard on Aging in Virginia.