Aging in Place in Virginia

In 2020, one in five Virginians (22%) was aged 60 or older. As our population ages, the demand for infrastructure and services to support older adults will continue to increase. One important issue that is gaining more attention is the concept of “aging in place,” which is this year’s theme for the national observance of Older Americans Month by the Administration for Community Living. Aging in place stems from the idea that a majority of older adults prefer to remain in their homes and communities as long as possible. *
To support individuals’ preference to age in place and prevent expensive and often unwanted institutional long-term care, policymakers are prioritizing their efforts toward providing home and community-based services (HCBS). For example, under the support of the federal Older Americans Act, the local Area Agencies on Aging (AAAs) and Title VI Native American aging programs have delivered a range of HCBS services to millions of older adults and caregivers by working with state governments and tens of thousands of local service providers and vendors.
Many communities have also developed grassroots and consumer-driven initiatives to address the needs and challenges of residents aging in place. The Villages or Naturally Occurring Retirement Community (NORC), for instance, provides supportive health and social services to older adults (within a specific geographic community) through existing formal aging services and programs and the assistance of volunteers.
Different Experiences behind Aging in Place
A recent report by AARP shows that 77% of adults aged 50 and above want to remain in their homes and communities as they age. Research shows that older adults prefer to stay in their homes and communities where they have long-standing relations with neighbors and feel safe. Aging in place also allows people to retain their feeling of autonomy with some level of independence.
Alternatively, some argue that “aging in place” has been romanticized and may not be an ideal solution for all older adults. For example, low-income older adults may have to stay in their places because they are not able to move to a better place that meets their needs due to limited financial resources. Research shows that older adults who involuntarily remained in their homes and community due to a lack of socioeconomic resources experienced worse physical and mental health compared to those who chose to stay where they lived. In rural contexts, older adults may voluntarily stay put due to strong emotional ties to their community even though aging in place may not offer them quality health care services or accessibility to the infrastructure necessary for basic needs.
When evaluating whether or not aging in place best supports the well-being of older adults, it is important to consider the context of an individual’s living environment and physical capacity. The experience of aging in place will likely change through the stages of aging. Older adults with higher levels of functional and cognitive competence are more likely to make use of community resources and more easily navigate spaces within and outside their homes. Oftentimes, these older adults are in relatively younger ages, also referred to as young-old adults. On the contrary, as older adults age, they may face more difficulties in coping with their living space due to higher mobility restrictions. For instance, aging in place in a spacious single-family house with stairs increases the risk of falls among older adults in very old age, which can result in severe impairment or even death.
Older Adults in Virginia
While data about the experiences of aging in place for older Virginians (60 years and older, sometimes also referred to as older adults) is limited, this article explores a few basic demographic patterns:
- Is there any urban/rural difference in aging in place?
- Is there any age difference in aging in place?
- Have the geographic and age patterns of aging in place changed in the last 10 years?
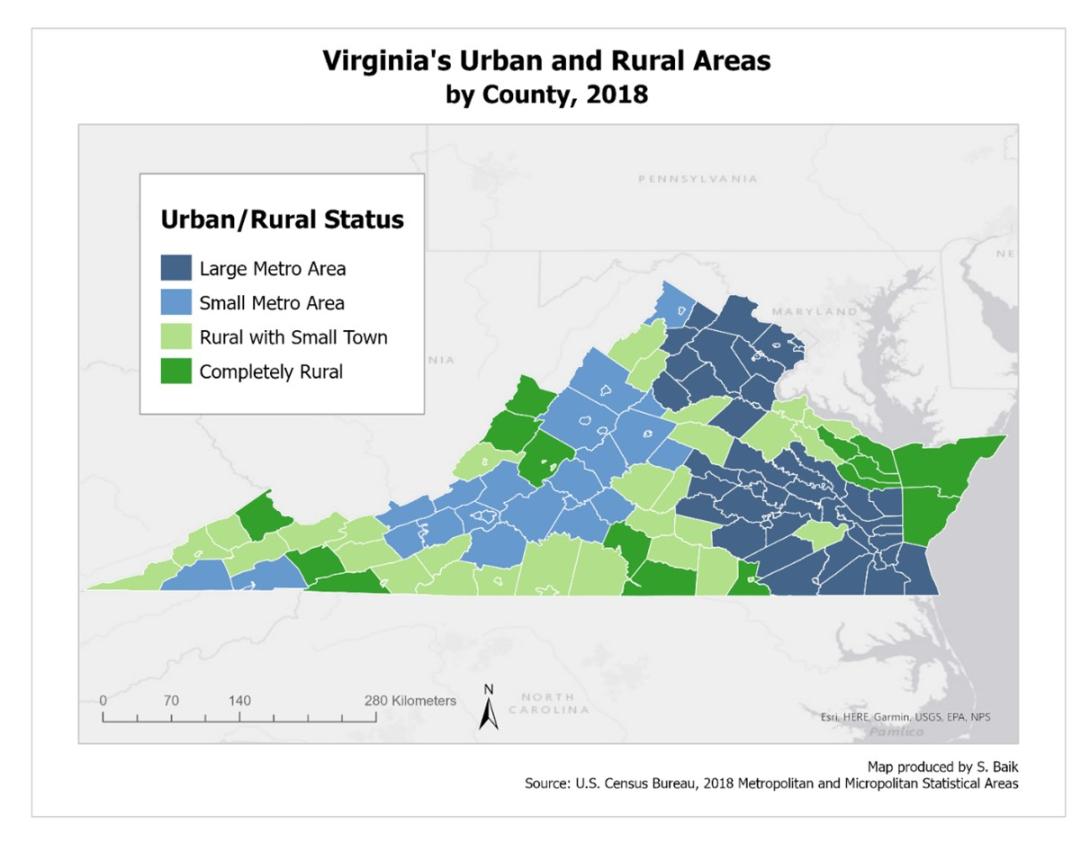
To understand the geographic, time, and age patterns behind aging in place in Virginia, we used the 2005-2009 and 2015-2019 5-year American Community Survey (ACS) data, which asks the respondents if they lived in the same house or apartment one year ago.** While this data does not necessarily provide an accurate measure of aging in place in Virginia, it is the closest proxy available so far. We grouped counties and cities into either urban (metropolitan areas) or rural (non-metropolitan areas). From there we further subdivided urban into two groups: large metro areas and small metro areas, and rural into two groups: rural with small towns and completely rural.***
Older residents are more likely to stay in the same house than the overall population
In 2009, 83% of the total population reported that they had lived in the same house for the last 12 months, compared to 94% of older Virginians. In 2019, ten years later, this pattern remains the same with 85% of the total population reporting that they have lived in the same house over the last 12 months, compared to 94% of older adults in Virginia. While younger people move mainly for jobs, older adults move for reasons that stem from the following: their beliefs and attitudes toward retirement (e.g., downsizing, lifestyle changes), life events (e.g., grandparenting, widowhood), finances, functional limitations and related safety issues, health events resulting in a transition to institutionalization or moving closer to amenities and family.
Rural older adults are more likely to stay in the same house than their urban counterparts
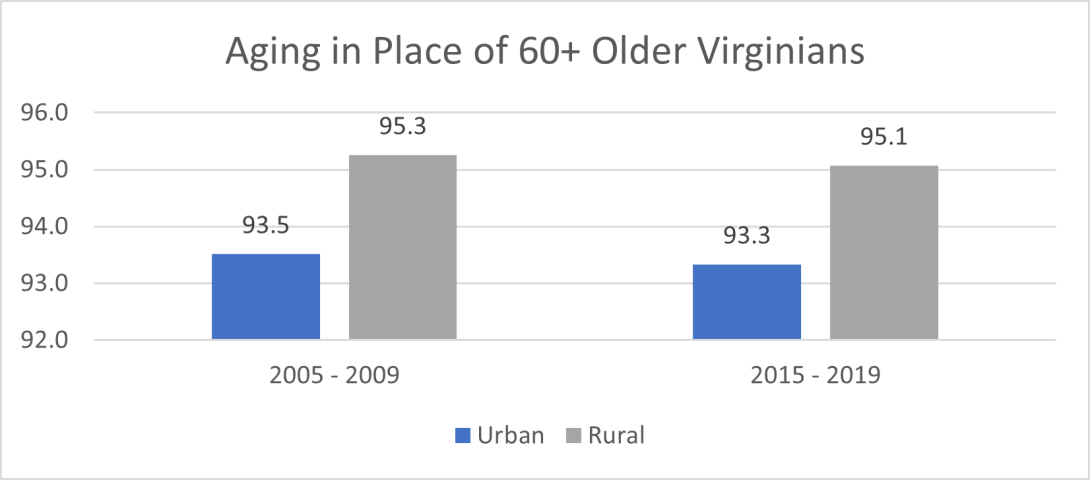
Figure 1 shows that older adults in rural areas remained in the same house at a higher percentage than older adults in urban areas. The percentages, however, decreased in 2019 for both urban and rural areas.
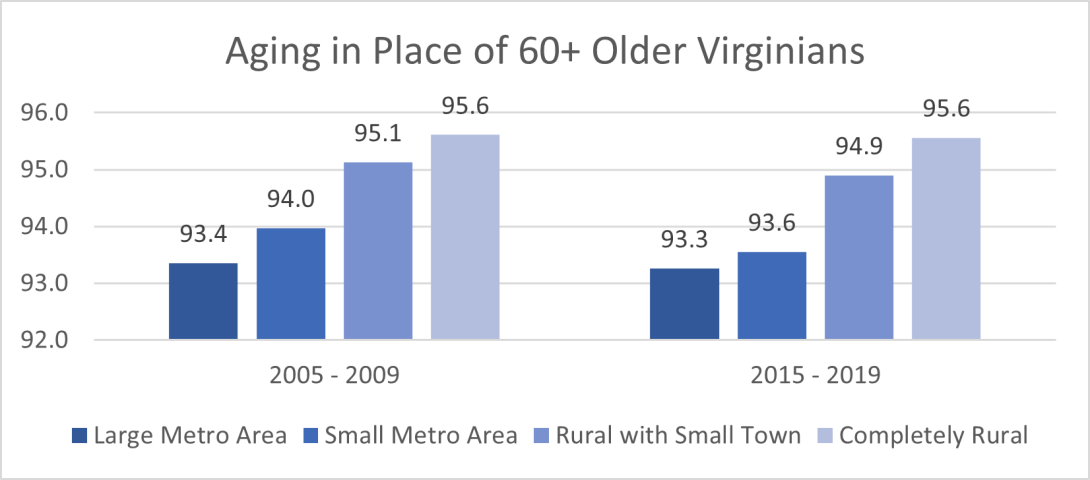
When we looked at the percentage of older adults who stayed in the same house by more detailed urban/rural categories, older adults who lived in completely rural areas showed the highest percentage (95.6%) of aging in place in both 2009 and 2019 (see Figure 2). In comparison, older adults living in large metro areas have the lowest staying rate, about 93%. This pattern between completely rural areas and large metro areas is consistent between 2009 and 2019.
Old-old adults are more likely to move than young-old adults in both urban and rural areas
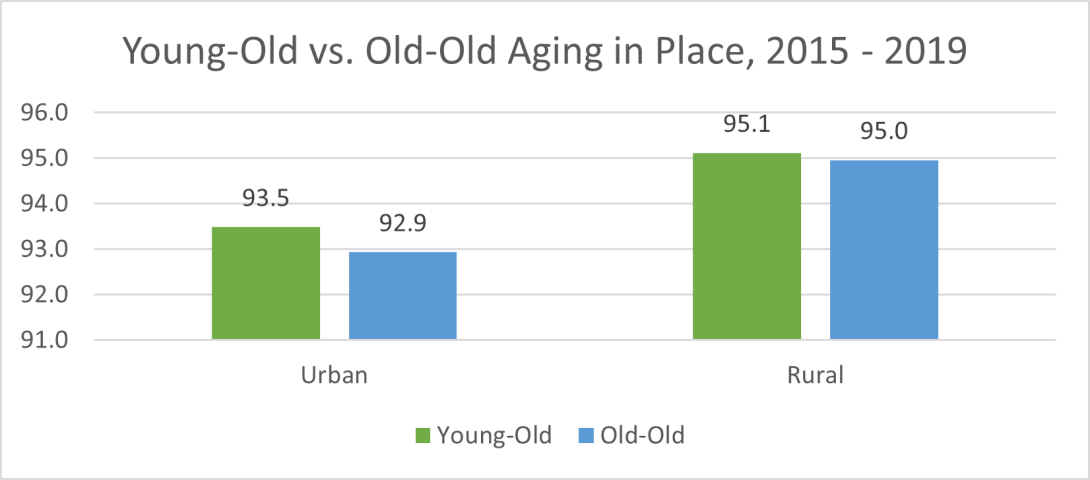
The lifestyles of individuals who are in pre-retirement or active retirement age are distinct from those who are older, often with physical and cognitive disabilities. To examine the age patterns of aging in place, we compared young-old stayers (age 60 – 74 years) and old-old stayers (age 75 years and above).
In 2019, in urban areas, a higher percentage of young-old adults stayed in the same residence over a period of 12 months, compared to the old-old adults, which was also true in the rural areas, although the difference was smaller (see Figure 3).
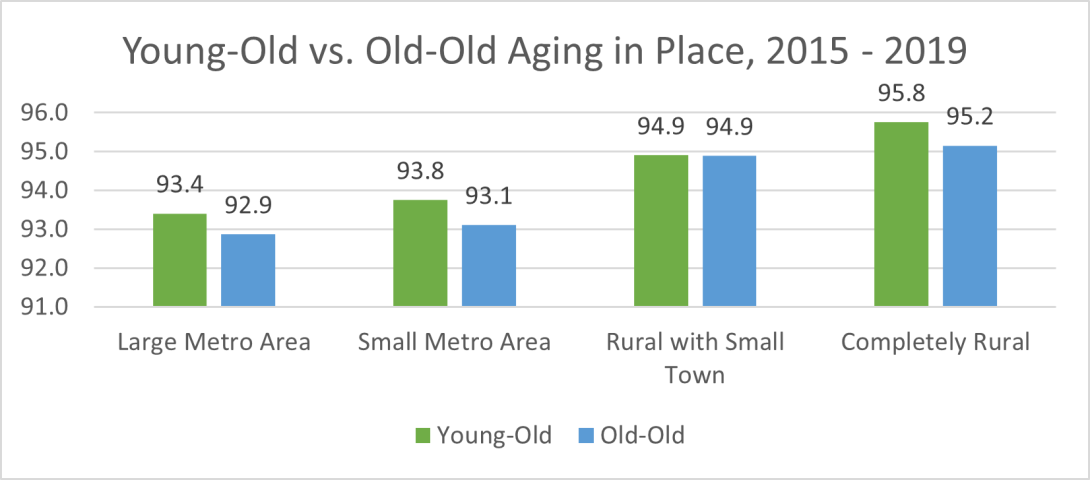
This pattern was similar in large metro, small metro, and completely rural areas, which all showed a higher percentage of young-old adults remaining in the same residence than the old-old adults (see Figure 4). As people age, they are more at risk of experiencing late-life disabilities, which may lead them to transition from living in their homes and communities to long-term care institutional settings. Our results show that this age pattern is consistent, regardless of urban/rural areas.
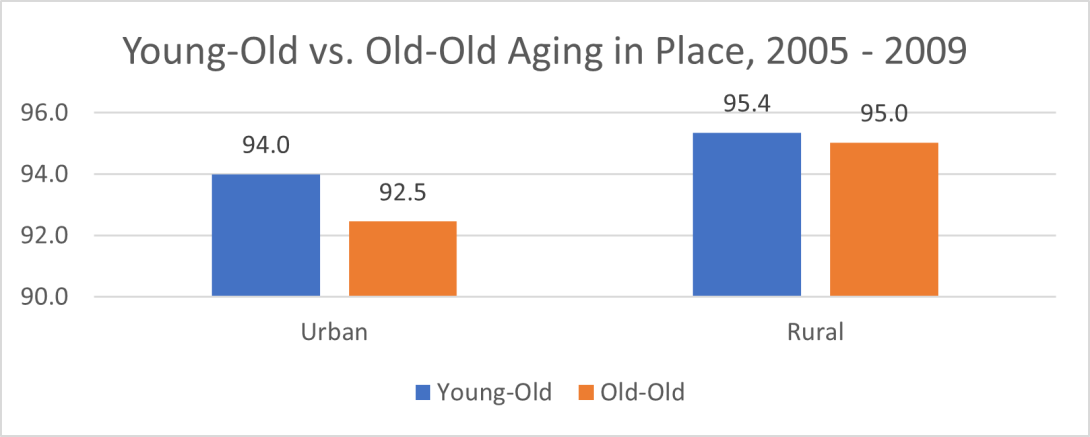
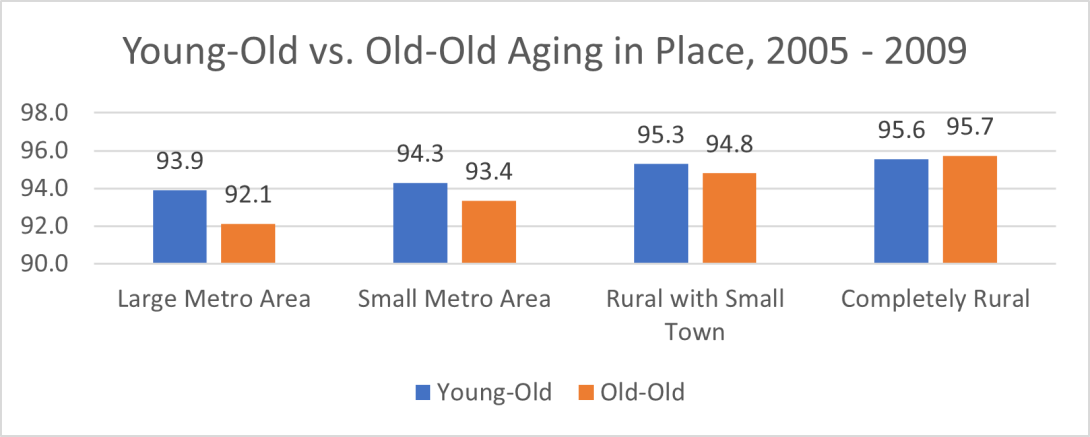
We also examined if this age difference of aging in place changed in the last ten years. Figure 5 shows that the age pattern of aging in place was consistent in 2009. A higher percentage of young-old adults stayed in their residence than old-old adults in both urban and rural areas. We observed similar age differences in large metro areas, small metro areas, and rural areas with small towns (see Figure 6).
Aging in place is an increasingly important topic for older Virginians and their families, organizations that provide services to older adults, and policymakers. It is complex and requires sophisticated research to better understand the needs and concerns. Yet, data for aging in place is very limited at this point. This article, using the ACS data, illustrates a couple of basic demographic patterns between urban and rural areas and between young-old adults and old-old adults. More in-depth information, perhaps through targeted survey and focus group interviews, should provide richer insights into older adults’ residential needs, preferences, and barriers, and tell a fuller story about who is aging in place and why, and what resources and circumstances allow for someone to successfully age in place.
__________________________
* The concept of home has been expanded to include not only one’s own home, but also other forms of housing, such as assisted living facilities, senior cohousing, or villages.
** Although 2016-2020 ACS data is available, due to quality concerns from data collection issues during the pandemic, we used the latest pre-pandemic data from 2015-2019.
*** We divided urban areas into large metro (i.e., a million or more residents living) and small metro (i.e., less than a million residents living) areas. For rural areas, we used 2010 Rural-Urban Commuting Area (RUCA) codes to separate rural counties into rural areas with small towns (i.e., codes 7 & 8) and completely rural areas (i.e., codes 9 & 10). When there were two or more records of primary RUCA codes for the locality, we categorized localities into rural areas with small towns where the category of the average of the primary RUCA codes is less than 9. Those which had the average of the primary RUCA codes 9 and above were grouped into completely rural areas.


