


Average Density of Virginia’s Metro Areas
Recently, I’ve been comparing a number of traits of metropolitan areas based on distance from the core. Here I’m looking at the average densities of each metro area as you travel outwards from the center, calculated using census blocks and 2010 short-form census data. I’ve graphed them in groups of three. Cities with a strong core will have high densities on the left (near the center) that fall off as you travel outwards. Cities whose densities fall off quickly on the right have clearer edges, while those that taper off slowly are more spread out. Click on the graphs to view them full screen.
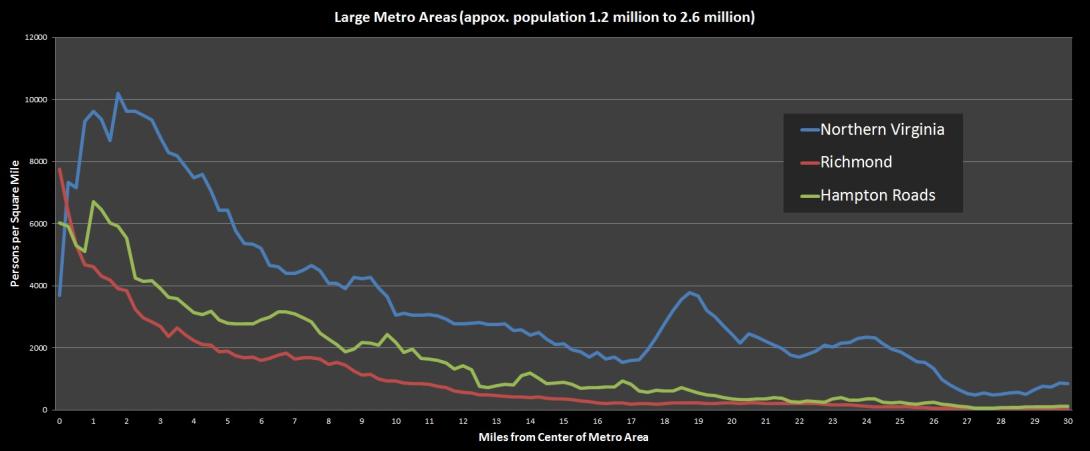
Three major metro areas
First are the three major metro areas. Note that the Northern VA graph includes only Virginia census blocks, not the rest of the DC area. Northern VA has the largest population by far, with fairly high densities even several miles into the suburbs. Richmond has the smoothest curve. I used downtown Norfolk as the core for Hampton Roads, but the area’s polycentricity is obvious.
Mid-sized areas
Here are the “mid-sized” areas: Roanoke, Lynchburg, and Charlottesville. Charlottesville is the most compact, with a significant urban area in the first two miles around the core that then rapidly drops to rural densities. Roanoke and Lynchburg, though similar in population, are more spread out. Development extends several more miles beyond the core at lower densities.

Small areas
Here are three “small” areas: Winchester, Harrisonburg, and Danville. Harrisonburg is the most compact of these. Danville has a historic urban core, but it has been slowly hollowed out due to population loss.

Edge cities
Finally, here are three areas I’m particularly interested in. I want to call them “edge cities,” but that has somewhat specific connotations in architectural theory. They are urban centers that exist at the periphery of the major metro areas: Petersburg outside Richmond, Fredericksburg outside NoVA, and Williamsburg outside Hampton Roads. Their density charts don’t drop off to rural levels because they extend to the major metro area.

How should you read all of these graphs? It’s tough to put a “typical” image on each density level because there is immense variation. It’s also important to remember that the densities charted here are obtained from all census blocks around that distance, so one particularly dense neighborhood may be balanced out by a low-density strip mall or a cemetery (Arlington Cemetery accounts for the low start and quick spike in the Northern Virginia graph). The functional end of development is usually signified by a drop in density to below about 300-400, though there may still be exurban development beyond that. A drop below 100 usually means a completely rural area.
Note that I’ve left out the Blacksburg-Christiansburg area (pop 150,000), which should be somewhere between the mid-sized and small metros, because it’s really an agglomeration with three separate cores and thus doesn’t work well with this form of analysis.