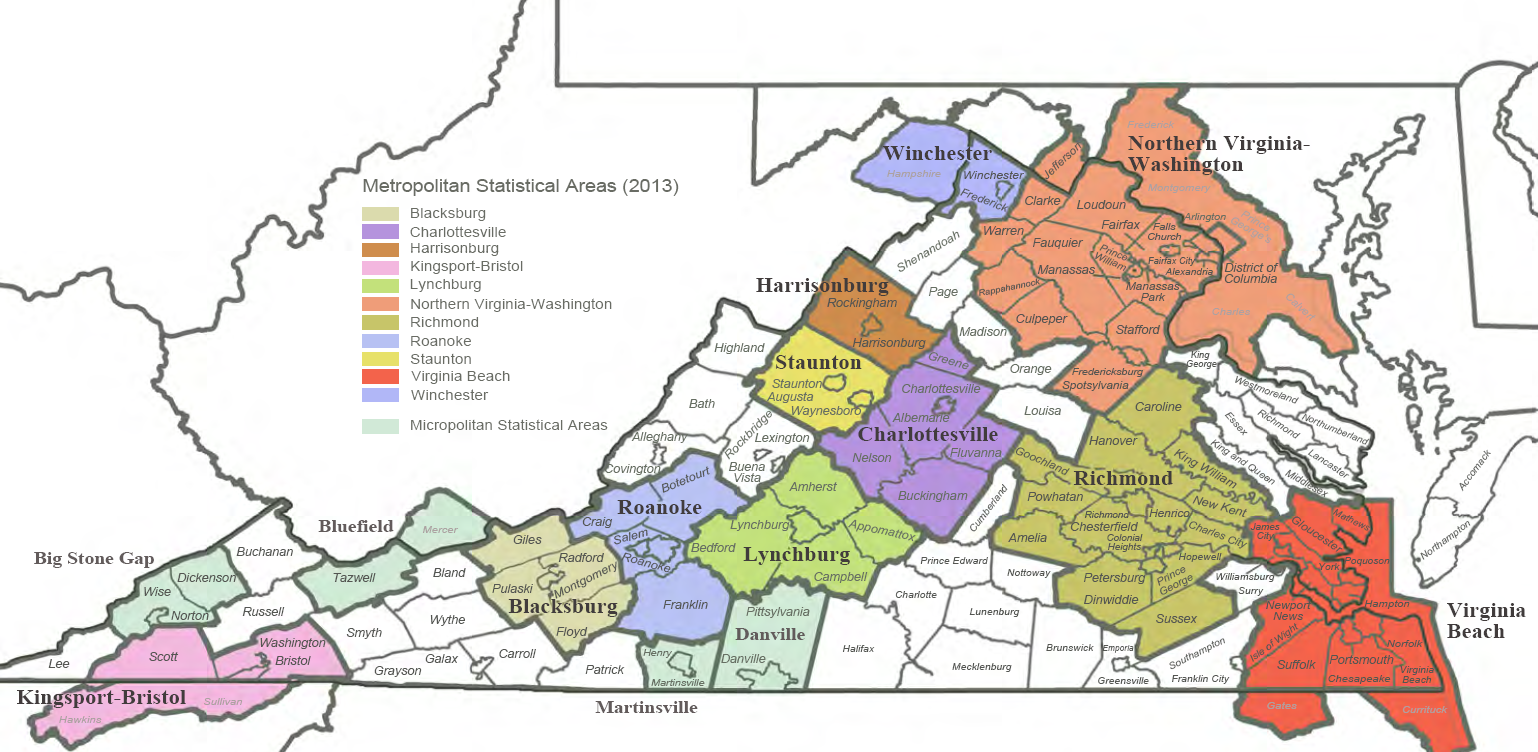
StatChat

A Closer Look at MSA’s and Commuting

As Hamilton noted when posting the map of updated Virginia Metropolitan Statistical Areas, the MSA’s are calculated with commuting statistics.  If more than 25% of workers in a locality commute to a nearby metropolitan area, that county is considered to be closely linked to it.  This is a useful cutoff point, but like all cutoffs, […]

Ancestry: Who do you think you are?

This is one of my favorite demographic maps. It was produced by the Census Bureau to show the most commonly reported ancestry for each county in the United States in 2000. Even though the data is over 13 years old, the map remains very popular. Largest Ancestry: 2000 Since a follow-up map for 2010 has […]

Virginia’s immigrants: Where do they come from and where are they now?

The foreign-born, or immigrants, comprise more than 10% of the Commonwealth’s population.  Most of them are between 25 and 44 years of age. This young cohort is highly active both in terms of production (working) and reproduction (having children). The adult foreign-born, for example, make up 15% of the Commonwealth’s workforce; and a fifth of […]

The Farm Bill’s odd couple: SNAP and agriculture

In January, I spent some time discussing SNAP in Virginia here and here; at the time, there was a lot of hypothesizing about what kinds of changes were in store for the program.In early February, the Farm Bill was passed by Congress and signed into law by President Obama. This bill reauthorized Federal funding to […]

What are the young people up to these days?

Much has been made of the living preferences and economic situation of millenials.  In the current economy, most localities can expect to lose almost all of their brightest young people to college towns.  Whether these localities are able to lure these college graduates back is another story, and an important one since (many argue) it’s […]

Virginia’s 2013 Metro Areas

Metropolitan Statistical Areas (MSAs) or Metro Areas are perhaps the most common way to define an urban region. Because many urban areas cross into multiple localities, such as in Hampton Roads, MSAs are frequently used in the public and private sector to understand an urban area and its suburbs. Despite the widespread usage of MSAs, […]

Virginia Population Estimates: Growing More Slowly

Every year, the Cooper Center produces the official population estimates for the commonwealth of Virginia. The estimates are based on changes since the 2010 census in housing stock, school enrollment, births, deaths, and drivers’ licenses. The estimates are used by state and local government agencies in revenue sharing, funding allocations, planning and budgeting.Slower Growth Overall This […]

A quick glance at School Enrollment Projections

Being primarily an Economist, and the newest member of the group, I still have a lot to learn about the demographic changes affecting Virginia and the US. So attending the Applied Demography Conference 2014 was a very educative experience for me. One of the subjects I found particularly interesting was school level projections, so here […]

SNAP in Virginia

An average of 922,150 Virginians– 11.6% of all Commonwealth residents– participated in the Supplemental Nutrition Assistance Program (SNAP) each month between January and December 2012.This social safety net program has received particular attention in recent months.  Not only has SNAP funding recently been reduced due to the expiration of the American Recovery and Reinvestment Act (ARRA), but […]

Official Poverty Estimates, in the US and the Commonwealth

This past weekend, The New York Times published an interactive map visualizing recently released Census data on poverty in America.  The NYT map gives information down to the census tract level; this level of precision allows the viewer to see poverty rates of not just counties and cities but, in fact, neighborhoods.As for Virginia, poverty […]