National Turnout Rates and Rankings
For 2012 election-related commentary, please see these recent posts :
- Forget Ohio, it’s all about Virginia…and demographics
- Virginia Votes 2012
- Virginia Votes 2012: Turnout across localities
- Lower turnout in 2012 makes the case for political realignment in 2008
As an extension of Michele’s recent post on turnout in Virginia, I decided to take a look at turnout rates at the national level. Using data from Michael McDonald’s U.S. Elections Project, CQ Press county election results, and the U.S. Census Bureau, I analyzed patterns in voter turnout rates for recent presidential elections.
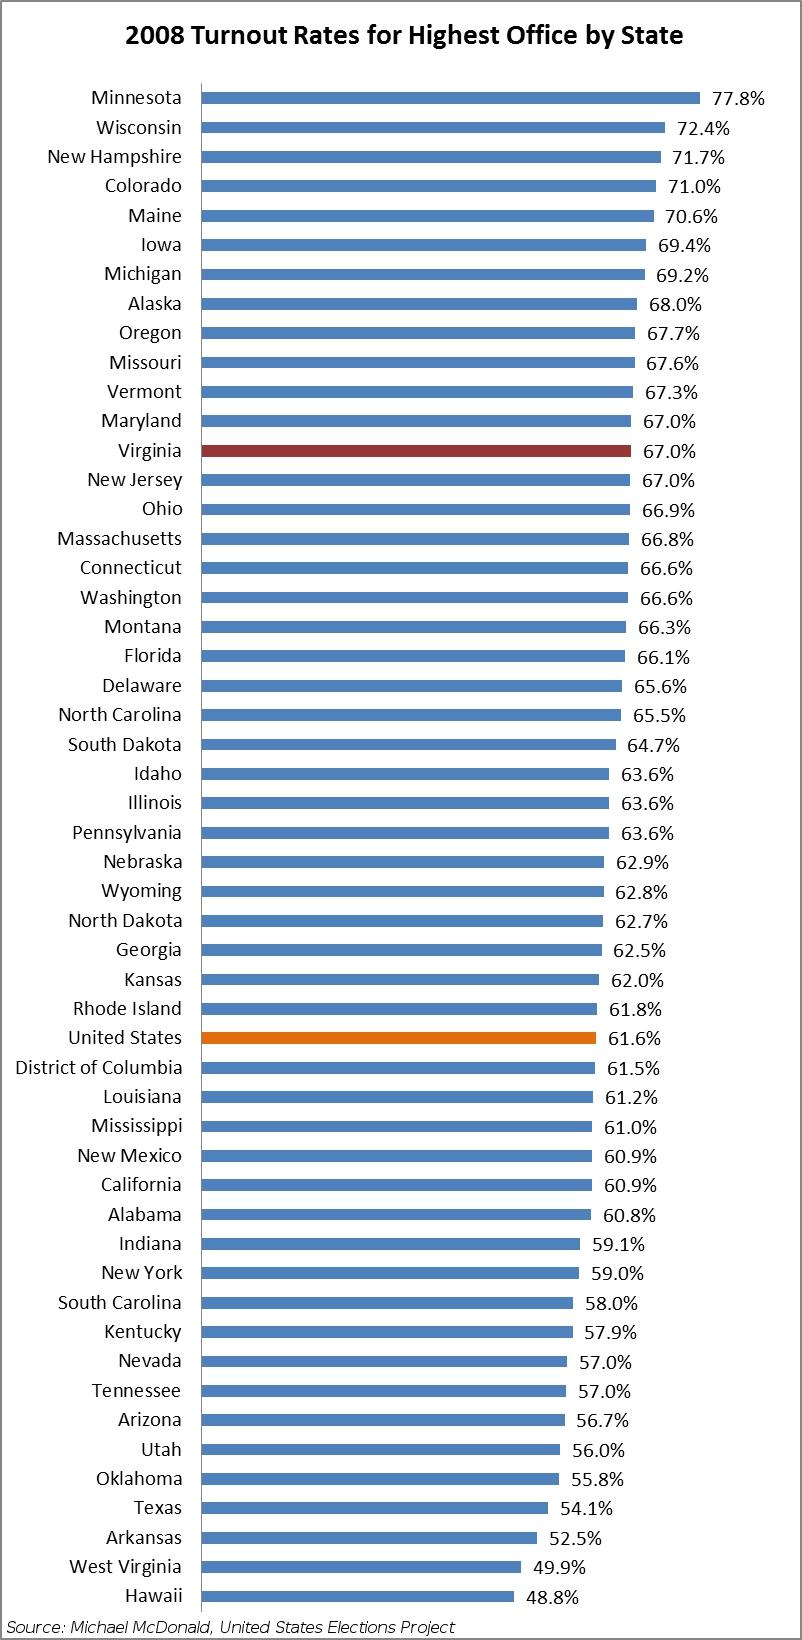
Virginia’s statewide turnout rate in 2008 ranked as one of the highest in the nation. In 2008, Virginia ranked 13th in turnout compared to other states with a record-setting 67.0% of eligible voters showing up at the polls, much higher than the national average of 61.6% and higher than other southern states.

This was a dramatic improvement from Virginia’s 2004 general election turnout rate of 60.6%, ranking 30th among other states and just surpassing the national average of 60.1%. In other words, Virginia is doing better, but still is a far cry from some of the nation’s highest turnout states, particularly Minnesota.
The State of Minnesota has had the highest voter turnout rate in the nation in seven of the past eight presidential elections (only to barely come in second to Maine in 1992) — and this is often by wide margins. In 2008, Minnesota’s turnout rate in the general election was 77.8%, compared to second place Wisconsin which had a turnout rate of 72.4%.
There is much speculation as to why Minnesotans show up at the polls at higher rates than other Americans. Part of the reason is surely rooted in the state’s moralistic political culture that highly values civic and political engagement (perhaps derived from the state’s heavily Lutheran heritage). Part of the reason is also rooted in deliberate election policy choices. While Minnesota does not allow early voting, the state has some of the least restrictive registration laws in the country allowing same-day registration and vouching for one’s identity by a third party. Minnesota also does not require government-issued identification at the polling place.
Virginia’s election policy could not be more different. One of our recent posts outlined Virginia’s comparatively restrictive registration rules and voting laws. Virginia’s high turnout in 2008 is even more remarkable considering these policies.
However, a less restrictive registration system might logically invite more instances of voter fraud. Yet, the available evidence of actual cases of fraud suggests that it is a relatively small, yet troublesome, problem given the large number of people who vote. For instance, in 2008 the right-leaning group Minnesota Majority reported 113 cases of known fraud in Minnesota, despite the state’s relatively lenient election laws.
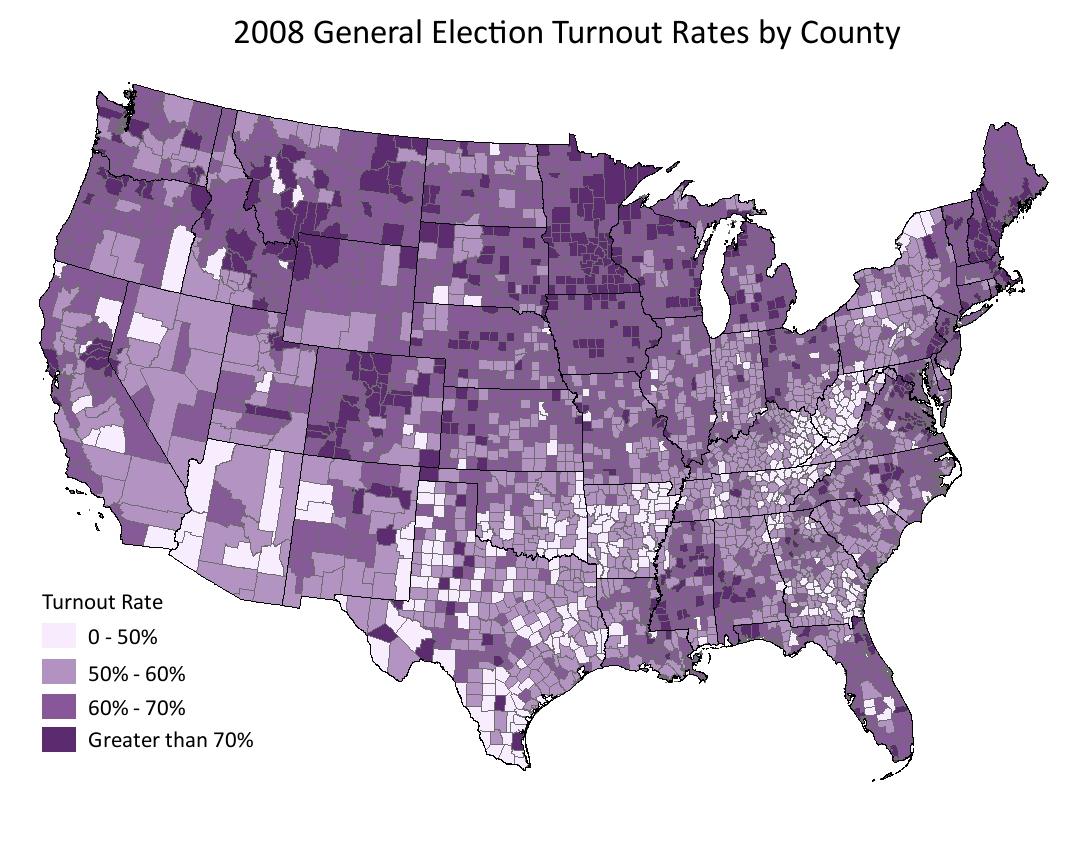
As Michele noted in her Voter Turnout post, there are significant regional differences in turnout within states, and these differences are often related to differential educational attainment and economic statuses among localities. Below is a map of all counties within the contiguous 48 states displaying 2008 general election turnout rates (as defined by total votes cast for president that year divided by the American Community Survey 5-year average citizen voting-age population centered on 2008):

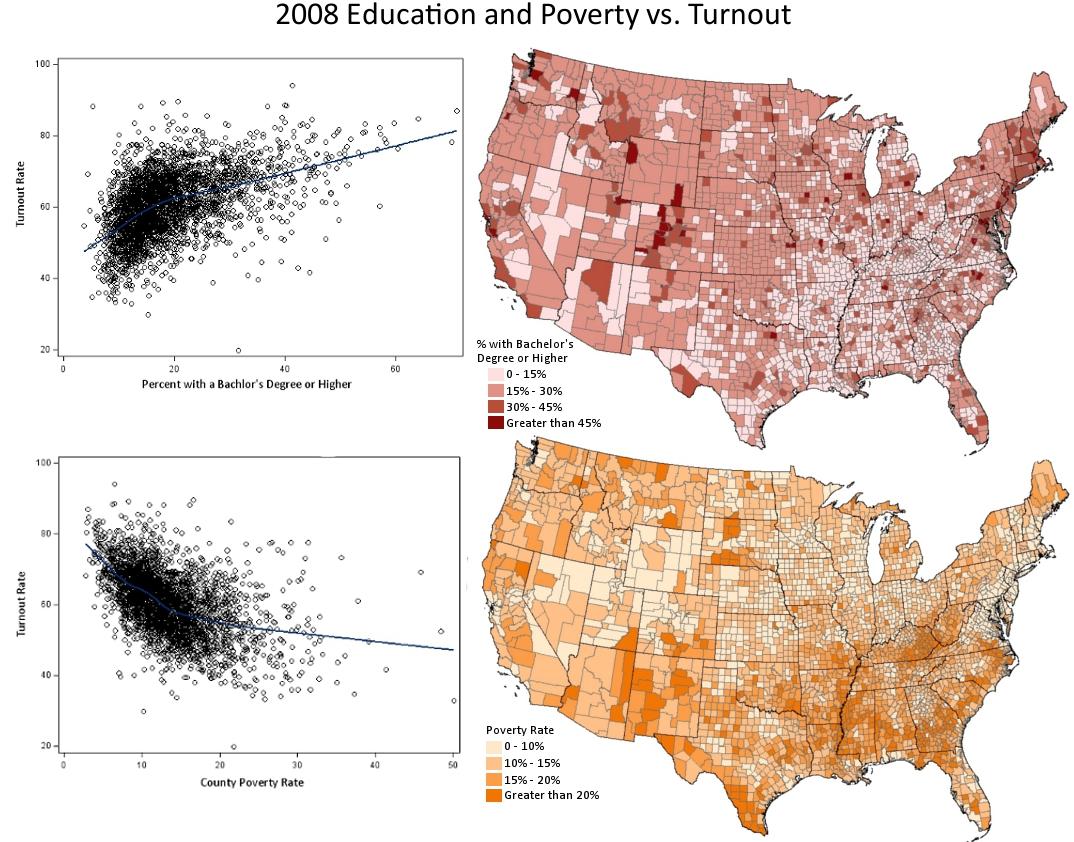
The lowest turnout regions of the country in 2008 were in Appalachia and parts of the South, regions with fewer people with college degrees and higher than average poverty rates. For comparison, below are maps showing the percent of people in each county with a Bachelor’s degree or higher and poverty rates along with scatter plots showing the relationship between education, poverty, and turnout rates:

As we saw in the Virginia example, education and poverty are correlated with voter turnout although the national picture is a little more complicated. For example, notable exceptions are some of the counties in Mississippi and Alabama with large black populations. Although these counties have high poverty rates and lower rates of having a college degree, their residents turned out to vote in larger numbers in 2008 than what might have been expected. Yet, the overall message is clear: education and economic status matter when it comes to showing up at the polls.


