Voter Turnout in Virginia
For 2012 election-related commentary, please see these recent posts :
- Forget Ohio, it’s all about Virginia…and demographics
- Virginia Votes 2012
- Virginia Votes 2012: Turnout across localities
- Lower turnout in 2012 makes the case for political realignment in 2008
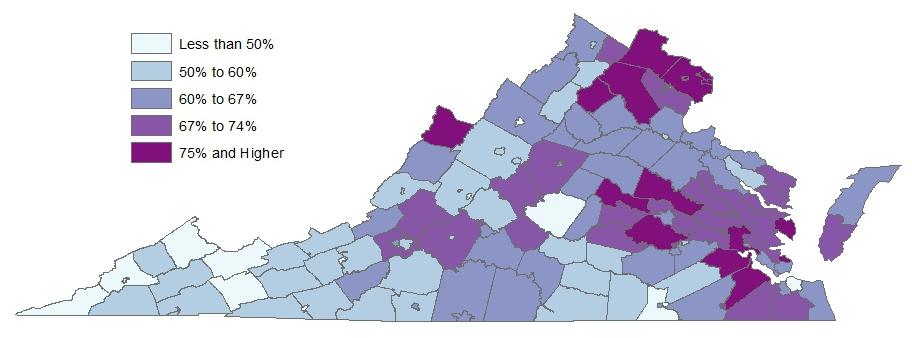
In the 2008 Presidential election, 67% of eligible Virginia voters cast ballots, the highest turnout rate in the commonwealth in the modern political period (up from 61% in 2004 and 54% in 2000). Of course, this comparatively high turnout didn’t occur evenly throughout the state. In fact, there was striking variation evident across Virginia’s localities: the maximum turnout rate occurred in the city of Falls Church, with 87% turnout among the pool of eligible voters; at the lower end, only 40% of eligible voters in the city of Radford showed up at the polls.
Voter turnout here is estimated by the number of ballots cast in a locality (as recorded by the State Board of Elections) divided by the citizen voting age population in the locality (U.S. citizens aged 18 or over, as estimated by the Census Bureau).
The map below shows the distribution of voter turnout across the state. The dark purple cities and counties had turnout rates much higher than the state total, with 75% or more of eligible residents turning out to vote. These are mostly localities in Virginia’s big metro areas: Northern Virginia, the Richmond area, and the Hampton Roads region.
The two lighter shades of blue denote localities where turnout was much lower than the state total, less than 60%. These are mostly in Virginia’s southwestern and Southside counties.

These patterns aren’t random. To provide a glimpse into what accounts for this dramatic variation in Virginia, below are two figures plotting turnout rates in the localities by education (the percent of residents with a college degree) and poverty (the percent of residents with incomes below the federal poverty threshold).
Scholars of political behavior have long known that education increases political engagement. Education increases the sorts of knowledge and skills that make navigating politics less overwhelming; and higher education tends to place people in positions where they feel more vested in policy outcomes and believe more strongly, with good reason, that their voices are likely to be heard. So we should expect turnout rates to be related to education. And they are.

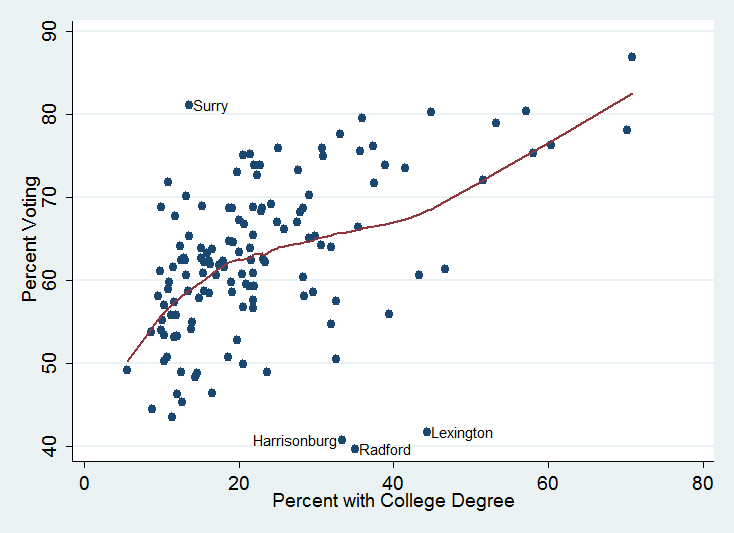
The figure plots voter turnout in each locality (the vertical axis) by the percent of residents 25 or over with a college degree (the horizontal axis).
In general, the localities with the smallest percentage of residents with a college degree (the points on the left side of the figure) had the lowest turnout rates in 2008, and the average turnout increases as the percent with a college education increases. There are a few notable exceptions, though. Surry County has a remarkably high turnout rate despite a relatively low rate of residents with a college degree. And Harrisonburg, Radford, and Lexington all have quite poor turnout rates despite strong rates of college degree-holding in these cities. These last three are all homes to colleges (James Madison University, Radford University, and Washington and Lee University, respectively), so their turnout rates are almost certainly being pulled down by the large number of college students in the city (counted as eligible voters in the locality) who are casting their ballots in their home districts (so are not contributing to the number of voters in the locality).
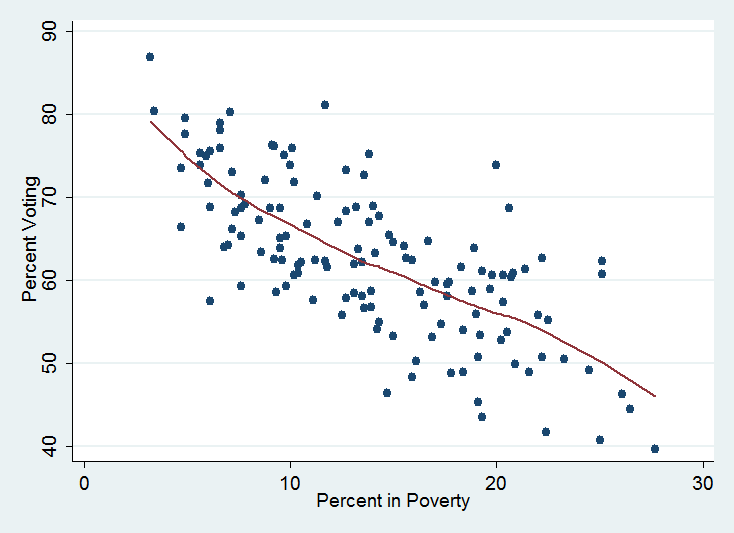
Further, poverty tends to depress turnout as poor people often feel alienated from the political system and lack the resources – time, money, and information – to feel confident following the political contest or effecting change. Poverty rates are even more strongly tied to turnout rates across Virginia, as the graph below shows.

Again, the figure shows that as the poverty rate in a locality increases, the turnout rate in that locality generally declines as well. For the interested, the correlation (a measure of the strength of the linear relationship between two variables) between turnout and college-degree holding is 0.48, a moderate and positive association; the correlation between turnout and poverty rates is -0.72, a strong and negative association.
One implication of these relationships is that in Virginia, as elsewhere in the nation, the least educated and the least financially well-off are also the least likely to have their voices heard in the political arena. Candidates spend more time appealing to constituencies – through campaign promises, appearances, policy priorities – they believe are likely to vote. And as scholarly research has demonstrated, voting rates matter beyond their impact on election outcomes: counties with higher turnout receive more federal money.
UPDATE: Some colleagues, intrigued by the claim in the last sentence — that counties with higher turnout get more from federal government — asked me to elaborate a little more. Why would high participation areas get more (even after controlling for measures of need, as the article linked article does)? Because officials “interpret higher voter participation within geographic areas as an indication of an attentive public.” Attentive publics are paying more attention to government and government returns the favor. So members of Congress, who cannot possibly address all the interests or groups seeking their attention, steer discretionary spending in their districts to areas where the public is more likely to take notice (and reward the member with votes in the next election, or so the member hopes — that’s not been clearly tested). In short, past turnout rates predict federal grant dollars to a county, and do so more consistently and more strongly than does the incumbents’ share of the vote in the county in the last election. Officials aren’t just rewarding support, they’re rewarding attention. Think of it as another reason to discharge your civic duty next fall.


