Lower turnout in 2012 makes the case for political realignment in 2008
Now that most states have finalized and submitted their official election results (yes, it does take that long), we can take a closer look into state and local turnout rates for the 2012 presidential election.
But first, an overview of the results…
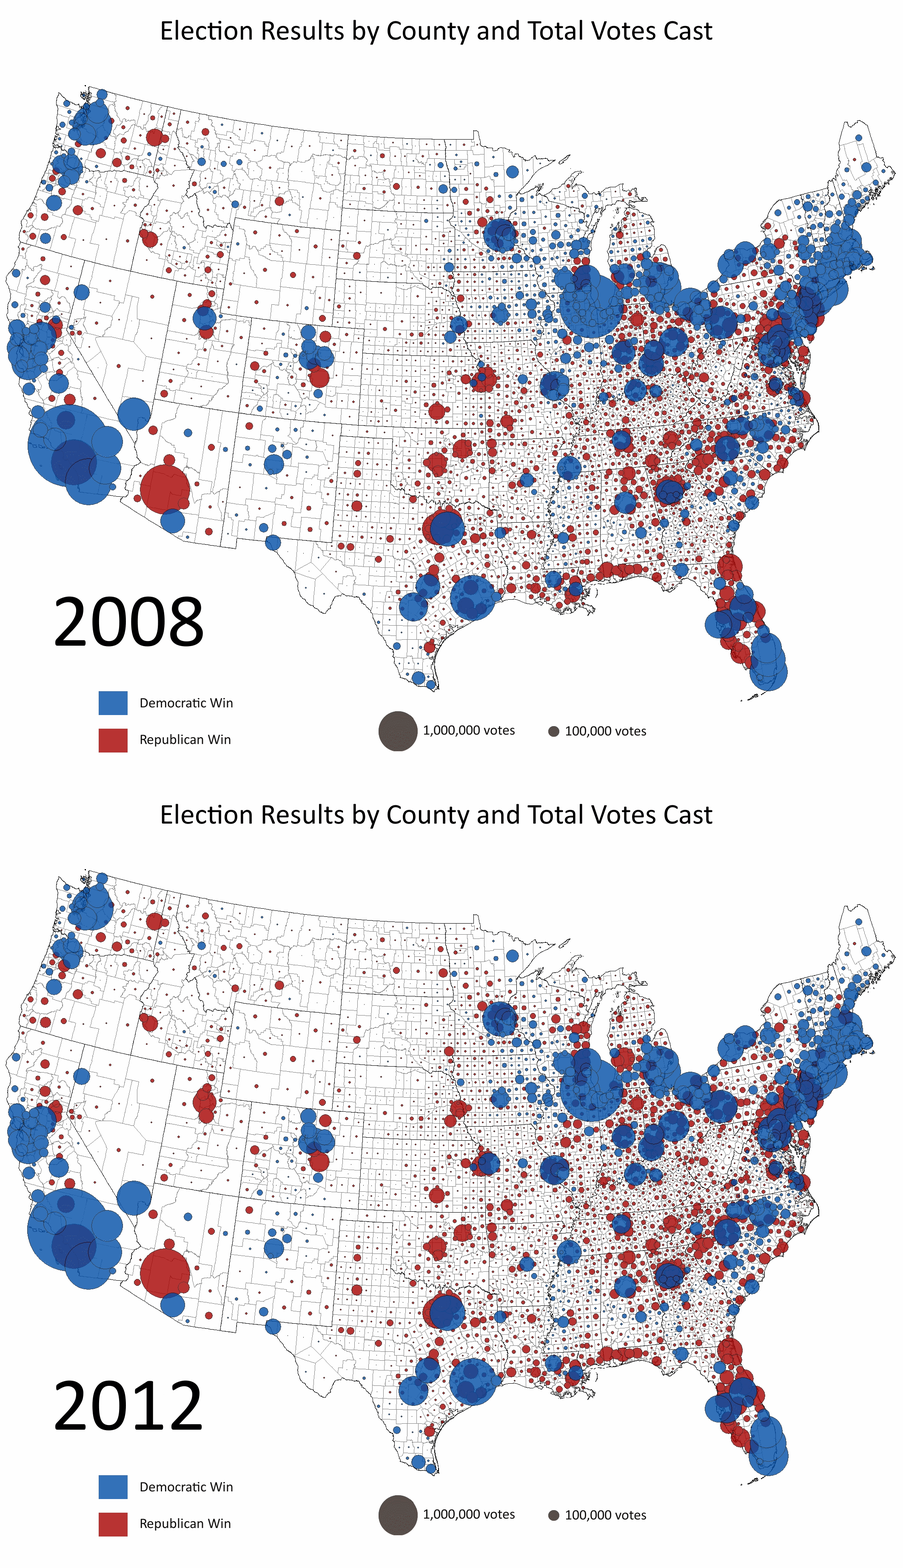
As we all know, Barack Obama will be starting his second term after he is inaugurated in a couple of days. While it would probably be hasty to say that Obama received a huge “mandate” from the election back in November, it’s fair to say he defeated Mitt Romney handily, with room to lose battleground states and still win. In fact, one of the more surprising results from the presidential election is how little the electoral map changed from 2008. The county-level results for 2012 and 2008 below illustrates this point:

Obama’s margins over his Republican challenger shrunk in most battleground states and was enough to flip Indiana and North Carolina, the only two states to switch between 2008 and 2012. But despite the slow and tenuous economic recovery, high unemployment, a controversial health reform law, and a slew of other things Obama had going against him during the campaign, nothing much changed. This was also despite lower turnout rates across the country.
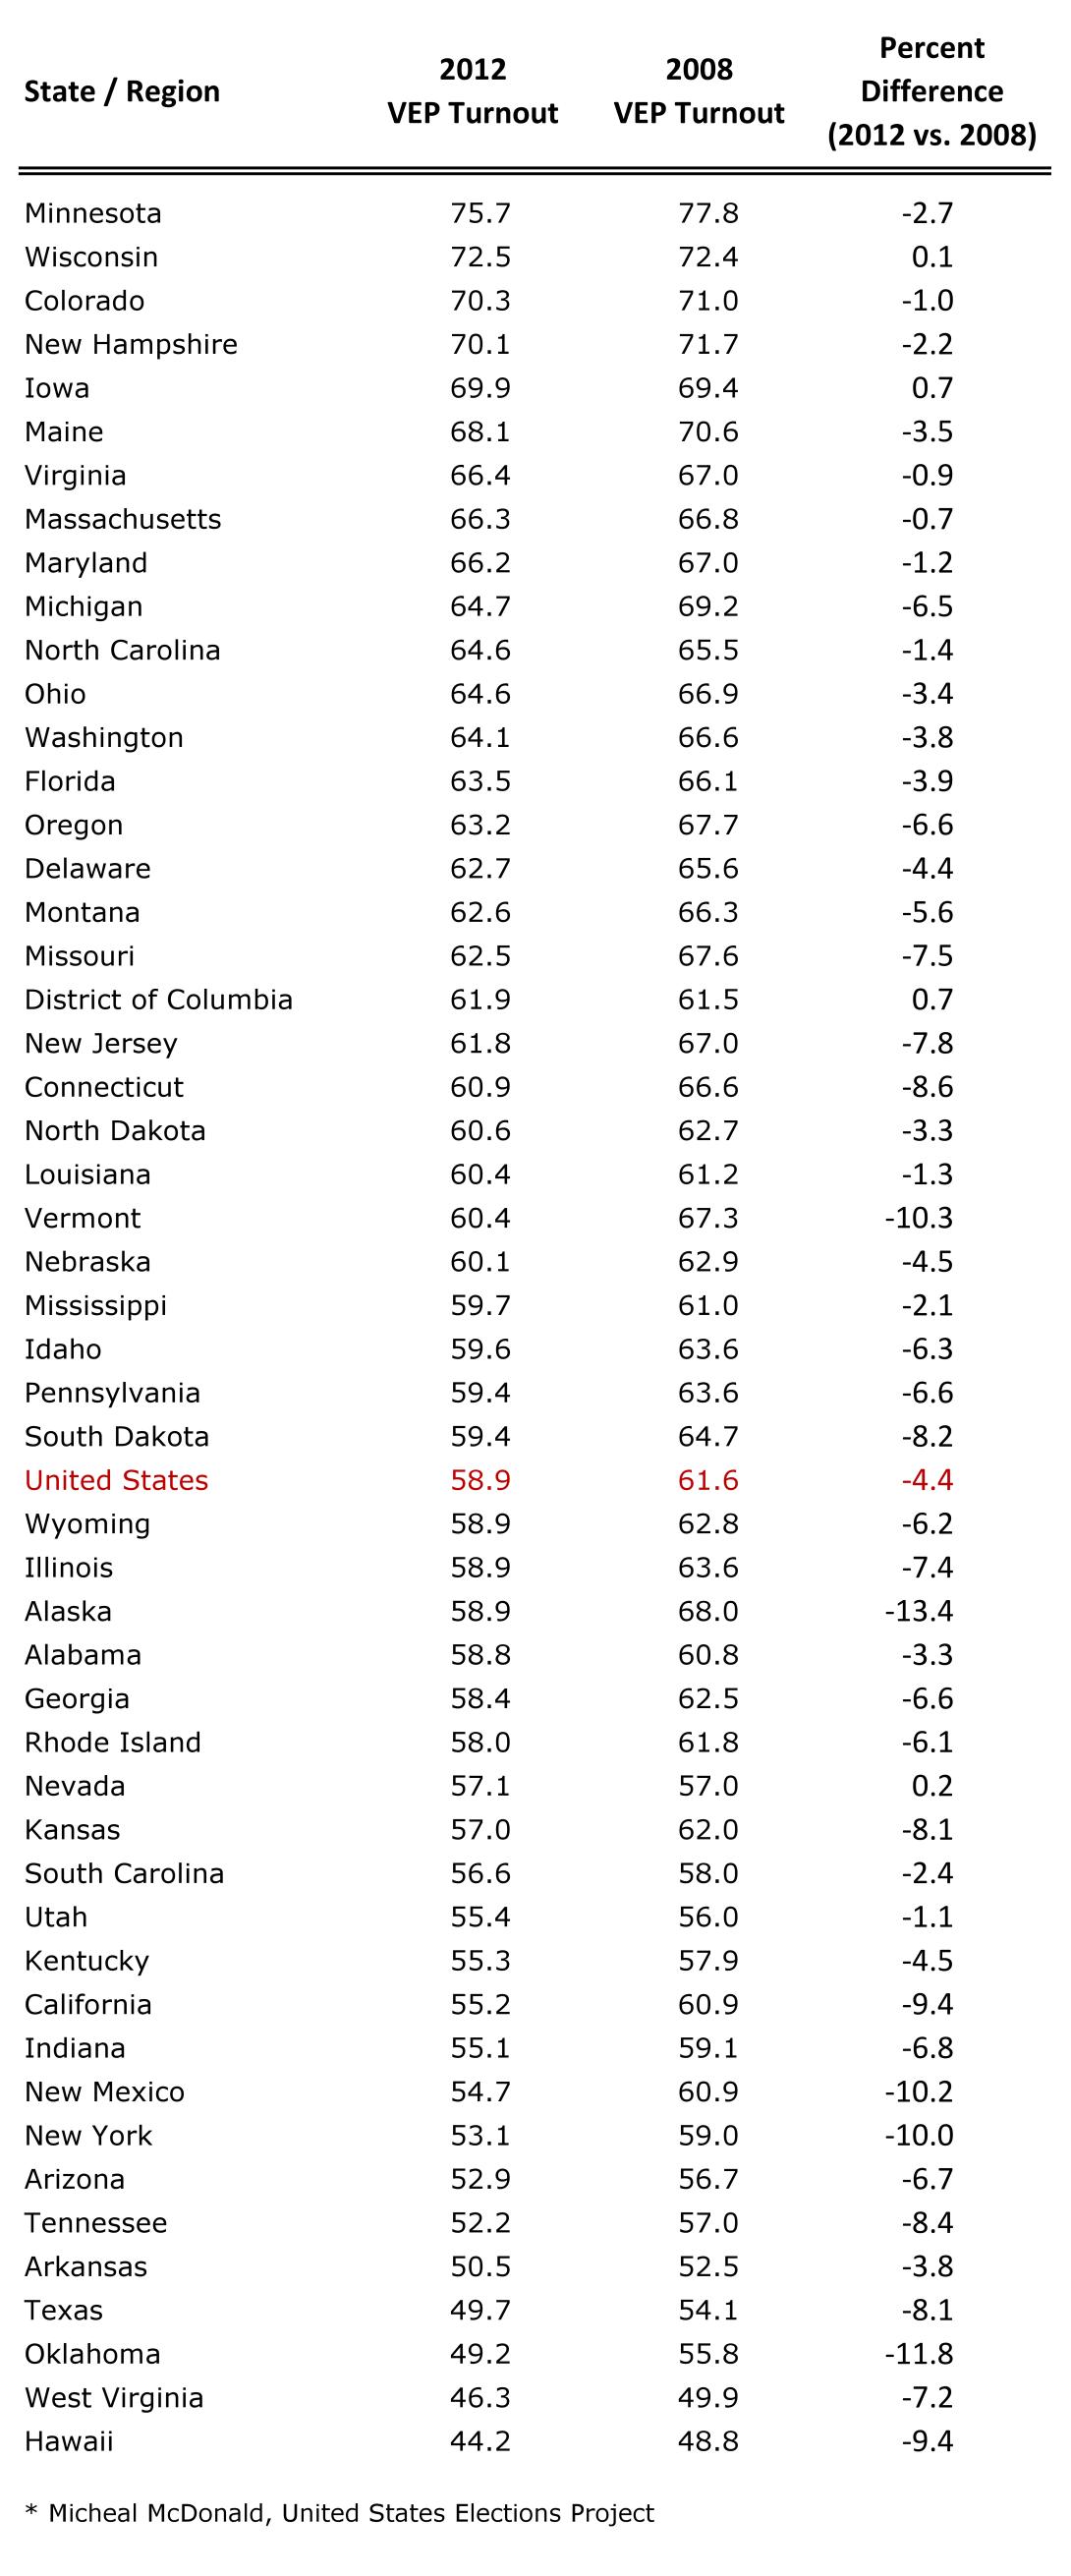
Below is a table of voting-eligible population (VEP) turnout rates for each state for 2012 and 2008 sorted from highest to lowest rates for 2012. Minnesota once again tops the list. Despite a significant decline in turnout from 2008, the Gopher State had room to spare to beat 2nd place Wisconsin which showed an increase in turnout from the last election. It is not too surprising that Wisconsin, Iowa, Virginia, and other battleground states were the few that either saw an increase in voter turnout or below average declines. For instance, Virginia’s recent battleground state status has elevated its rank so that this previously ignored political landscape in presidential politics now rubs shoulders with the top ten states in voter participation.

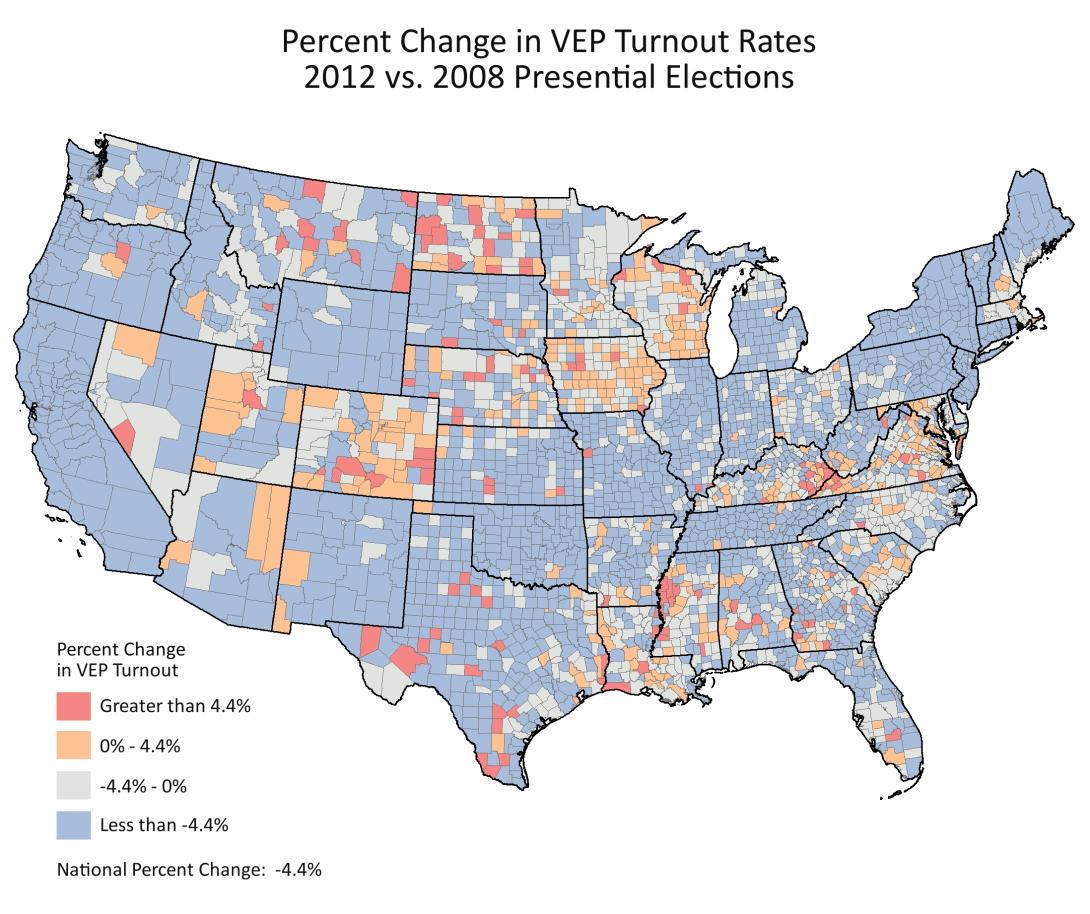
At the county level, turnout rates (calculated as the total number of cast ballots divided by the voting-eligible population projected from American Community Survey data) echoed the pattern seen in 2008. Perhaps more interesting is the percent change in turnout between the two elections for each county which is displayed below.

Many battleground counties saw increases in voter turnout from 2008. A case in point are the fast growing Northern Virginia, Washington D.C., exurbs, where each campaign set up numerous events and spent a considerable amount of money on local air time. Rural parts of Wisconsin also saw increases, perhaps as part of a valiant attempt by state conservatives to flip this traditionally blue state over to the red column. Besides some of these hot spots, however, the nation mostly saw significant decreases in turnout, as evidenced by the vast swaths of blue across the country in the map above. Despite all of the attention given to Ohio, residents there were not as motivated to turnout (perhaps due to election fatigue). Also, the very populous states of California and New York had no county that had a higher turnout rate in 2012 than in 2008. Texas did not look too much better and is in the bottom ten of states in terms of turnout.
—–
This recent low turnout election provides evidence for an intriguing development in American politics.
The term “Political Realignment” is starting to be thrown around a lot when describing the 2008 election, and from a demographic standpoint, describing what happened four years ago as a fundamental shift in the electorate makes sense. Many parts of the population, racial minorities and young people in particular, who have historically had low turnout rates, suddenly, and in large numbers, showed up to vote.
The 2008 results, by themselves, might not mean too much. The 2008 election could have been an aberration, and this is certainly what Republican pollsters in the recent presidential campaign assumed and hoped for. Minority groups and young people have historically been fickle voters, they don’t show-up as consistently and regularly as, say, older white men. So, many Republican pollsters assumed a voting population that looked more like the 2004 electorate that elected George W. Bush (more white, less young) and developed strategy around that assumption. The 2012 election results proved them wrong. Minorities and young people did vote and made up an electorate that looked a lot more like 2008 than 2004.
Historically, lower turnout elections, like 2012, usually meant that young people and minorities stayed home in larger numbers than their white, older, and more consistently participatory counterparts. Interestingly, exit polls show that the demographic make-up of the 2012 electorate stayed largely the same as in 2008. The lower turnout seems to have been more evenly distributed across demographic groups.
So far, the case for the 2008 political realignment is convincing and data from the 2012 election, that is still pouring in, provides stronger evidence for it. Everyone knows that the country is inching towards majority-minority status, but few anticipated that a solid coalition of minority voters (who also happen to be disproportionately young) would make their voices heard so soon. We’ll have better data on voting demographics and registration patterns when the 2012 Voting and Registration supplement of the Current Population Survey comes out later this spring. Until then, you can take a look at exit polling data for 2008 and 2012.
It could very well be the case that this electorate shift will not yet be reflected in the congressional midterm elections, which typically display much lower voter interest and hence lower turnout rates. Not too long ago, the 2010 mid-term elections brought a very sizable and very conservative majority to the House of Representatives. It also remains to be seen whether either party can continue to capitalize on these growing populations. For instance, can another Democrat who is not Barack Obama garner their enthusiasm and support, or is this shift particular to a specific candidate?


