Official Poverty Estimates, in the US and the Commonwealth
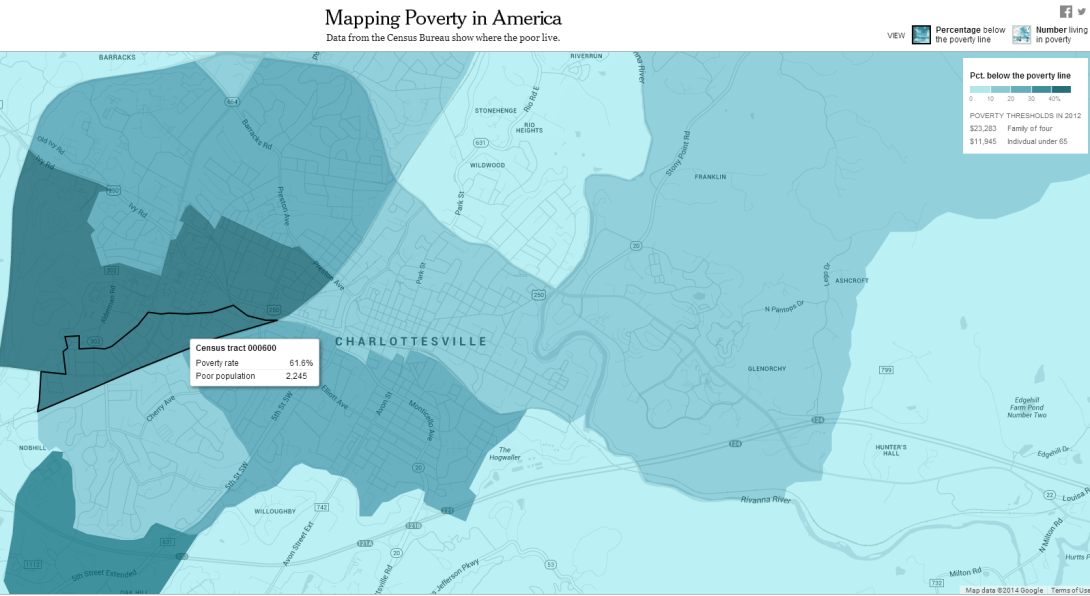
This past weekend, The New York Times published an interactive map visualizing recently released Census data on poverty in America. The NYT map gives information down to the census tract level; this level of precision allows the viewer to see poverty rates of not just counties and cities but, in fact, neighborhoods.
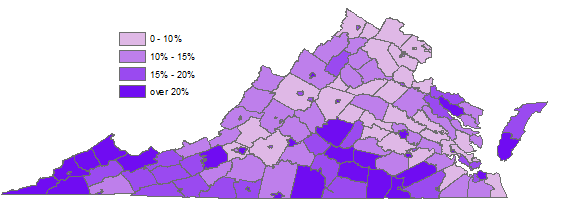
As for Virginia, poverty rates in Southwest, Southside and Hampton Roads far exceed the poverty rates of localities closer to DC. According to these small area estimates, Falls Church County has the lowest poverty rate of around 3 percent, while Radford City and Harrisonburg City have the highest rates (34.2 and 37.5 percent, respectively).

This is rich, wonderful information to have at our fingertips, but it’s important to keep a few things in mind while browsing. First, as the Census Bureau explains, there is uncertainty in these estimates. The numbers do not reflect a direct count but, instead, combine survey and administrative data.
It’s also helpful to keep local population characteristics in mind when interpreting this information. Consider Charlottesville, where a high percentage of residents living near University of Virginia appear to live in poverty. In particular, Census tract 000600 seems to have a poverty rate of 61.6 percent.

However many of these individuals are students living off campus (or, as many of them might say, “off Grounds”). Many of these students, though in official poverty by virtue of their own low personal incomes, may benefit from parents’ resources. Thus, “percent in poverty” may, in some cases, overestimate financial distress. The student population may also influence the high rate of poverty we see in Harrisonburg City, home to James Madison University.
On the other hand, percent in poverty may also underestimate financial distress for certain populations. As previously mentioned on this blog, the official poverty rate might not be the best way of measuring the true financial resources available to households. Incorporating additional factors, such as regional cost of living and additional sources of income and expenses, into calculations of poverty helps paint a more accurate picture of the economic realities faced by individuals and households.
For example, while the median income of Northern Virginians is higher than that of Virginians living in Southwest, Northern Virginians also face considerably higher housing costs. Methodology for a poverty measure that takes these, and other, considerations into account is detailed in the report The Virginia Poverty Measure: An Alternative Poverty Measure for the Commonwealth. Under the Virginia Poverty Measure, we see higher rates of poverty for NoVa residents.
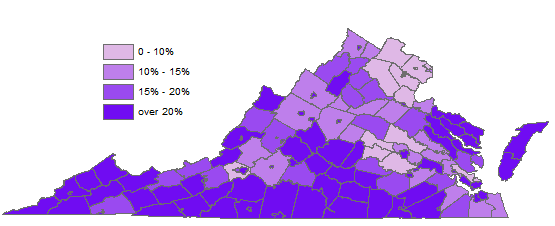
The data released by the Census Bureau also allows us to examine poverty among a few different age groups. Of particular note is the child poverty rate, or percentage of individuals under the age of 18 living in official poverty. A visual representation of child poverty in Virginia shows, again, that rates are higher in the south and southwest portions of the Commonwealth. However, a comparison of the maps reveals that rates of child poverty are generally higher than rates of overall poverty. Many social safety net programs, such as Temporary Assistance for Needy Families (TANF), the Special Supplemental Nutrition Program for Women, Infants, and Children (WIC) and the National School Lunch Program are in place to specifically target child poverty; using the Virginia Poverty Measure, which counts benefits from these programs among families’ financial resources, we see lower rates of poverty among children, and higher rates of poverty among the elderly.

Maps like the above demonstrate considerable variation of poverty rates not only across the country, but also within the Commonwealth. These variations–between young and old, urban and rural regions, or even across county lines–suggest the need to consider geography, as well as a broader range of financial resources and expenses, for a more accurate measure of economic hardship.
________________
*Source: United States Census Bureau, Small Area Income and Poverty Estimates 2012


