New Demographic Data on the 2012 Presidential Election
The recent release of the Census Bureau’s Voting and Registration data from the Current Population Survey finally allows us to look deeper into the population that turned out to vote this last November. And the results are quite astonishing.
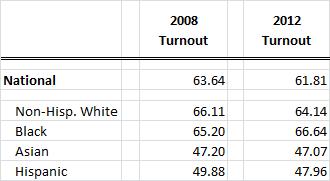
For the first time, in a long history of disenfranchisement and suppression, African-American voter turnout surpassed the turnout rate among whites. 2012 was a low-turnout election overall, especially when compared to 2008, and the turnout rates among most of the major racial and ethnic groups went down from 2008 rates. The turnout rate among blacks in 2012, however, went up.

There are many possible explanations for this historic turnout rate among African-Americans. Habit and significance surely have something to do with it. Once people vote once, they are more likely to do so again, especially if they feel invested in the outcome. Those blacks who turned out to vote for the first black president in 2008 were more likely to vote for him again in 2012. The 2012 turnout numbers might also underscore some of the deep political divisions of the county, which are increasingly drawn along racial lines, with the Republican party seen as being out-of-touch by many minority voters.
Another compelling explanation may lie in the black Baby Boomer population. While other age groups had declining turnout rates, the overall increase in turnout among African-Americans in 2012 is mostly due to increased turnout among the Baby Boomer cohort; these were individuals who grew-up in and lived through the Civil Rights Movement and were perhaps less likely to take their voting rights for granted. The recent Voter-ID laws, proposals, and sometimes blunt strategic rhetoric on the issue has had many civil rights groups and the NAACP make comparisons to past disenfranchisement efforts. This may have been a compelling force for the black Baby Boomer Generation to turn out to vote.
There are other striking results from the recently released data; all of them point to a 2012 electorate that looks very similar to the 2008 electorate. The population age 18 to 29 saw a dramatic decrease in their turnout rate from 2008. Yet, because many Millennials are just entering voting age, the overall growth in this cohort meant that young voters made-up a similar share of the voting population as in 2008. A similar dynamic happened among Hispanics and Asians. Although their turnout rates dropped in 2012, they made up a slightly greater share of the electorate because of their numeric growth in the population.
As I argued in a previous post, the 2012 presidential election provides evidence that a fundamental political realignment has occurred in this country. The newly released Census Bureau data confirm this and provide greater detail on the demographic forces underpinning this shift.
Now let’s take a look at ground zero for this political realignment: Virginia…
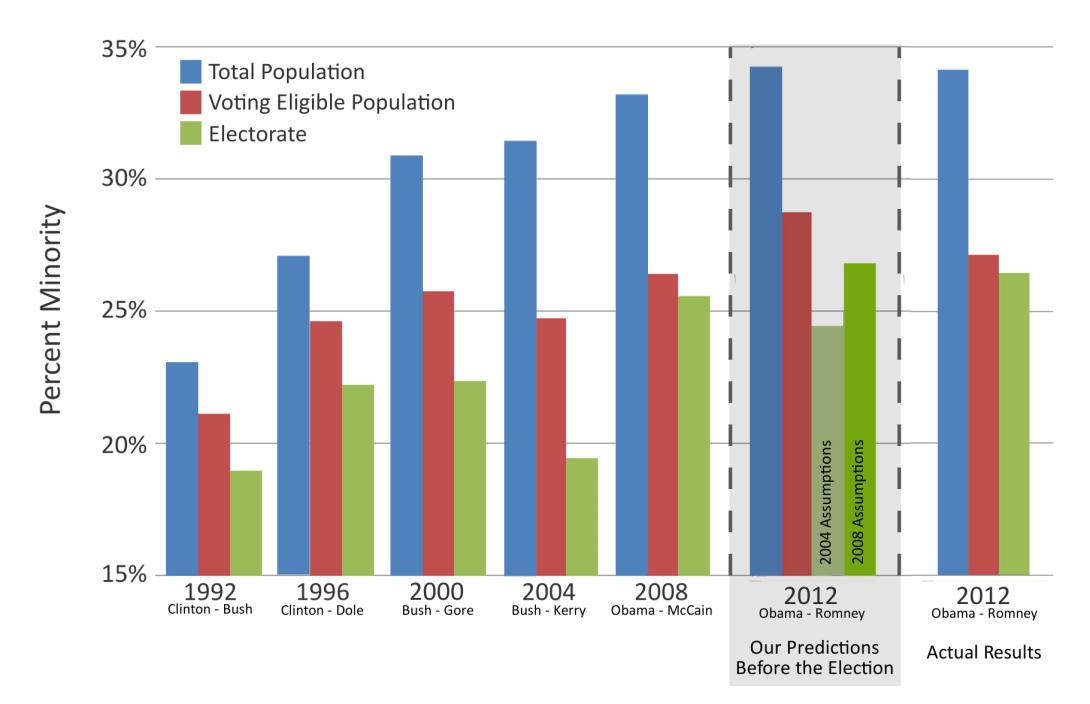
A year ago, Michele and I published a report on the major demographic trends in Virginia and how they influenced, and will continue to influence, presidential politics in the state. A part of that analysis was gaming-out 2012 election scenarios based on demographic projections. Now that I have the data, I can see how well we did.

As shown, while we got the total minority population just right (blue bars), we overestimated the growth in the Hispanic citizen population and thus overestimated the share of the voting-eligible population belonging to minority groups (red bars). However, racial and ethnic minority share in the electorate (green bars) fell right between our two projections based on 2004 and 2008 turnout assumptions, but closer to the 2008 scenario. Republican pollsters during the campaign tended to believe more in the 2004 assumptions, while Democratic polling firms believed that 2008 patterns were more illustrative of what might happen. The 2012 election proved the Democrats were more right than the Republicans when it came to polling and election predictions.
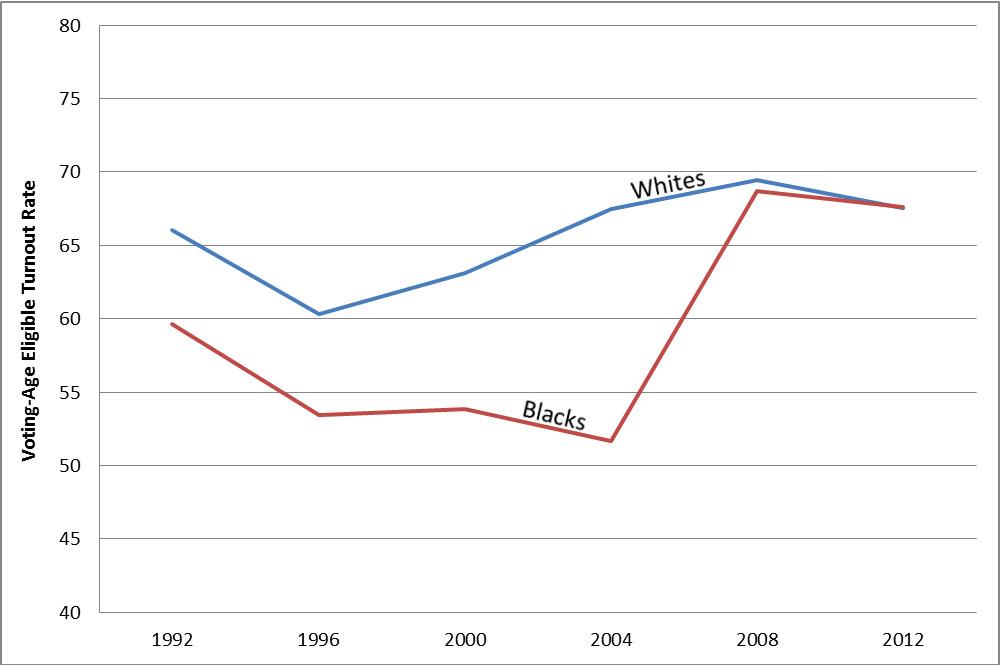
In the Virginia case, black turnout was a major contributor for the greater minority share in the electorate. Just as blacks had higher turnout at the national level, black turnout in Virginia was also up in 2012. The following figure shows turnout rates between Non-Hispanic whites and African-Americans in Virginia:

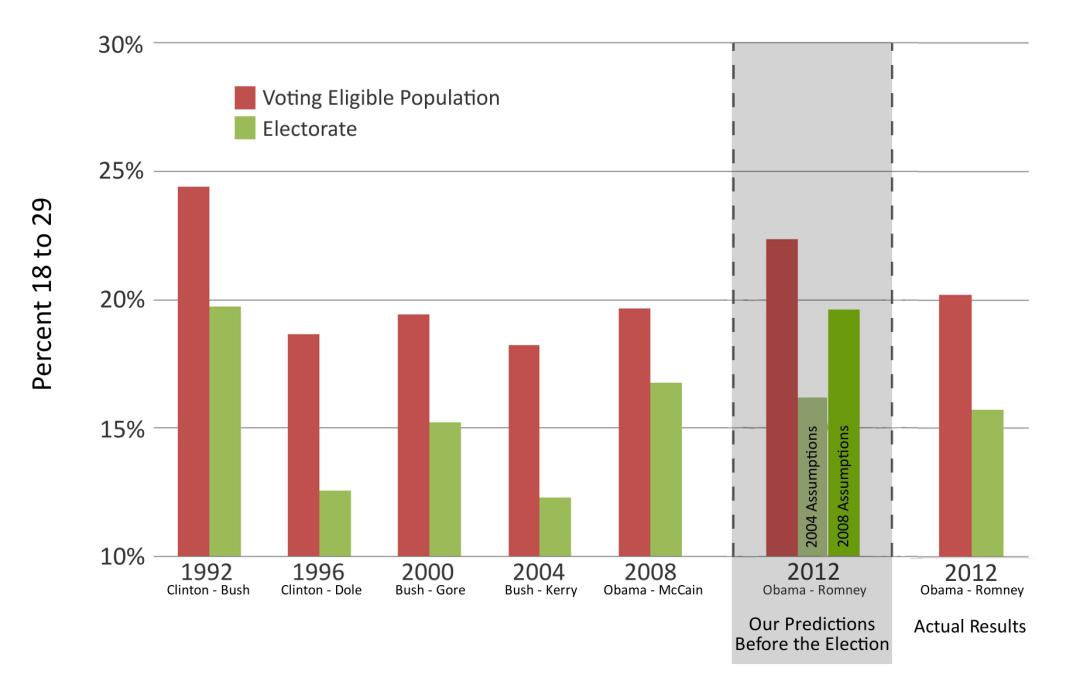
The table below shows the young population’s share of eligibles and the electorate in Virginia. As a result of overestimating the growth in the Hispanic population, we also overestimated the growth in the voting-eligible population age 18 to 29 (again, the red bars). While their share of the pool of possible voters grew, the lower turnout rates among this group ensured that they were a smaller share of electorate (green) compared to 2008 (but still greater than all previous elections since 1996).

By looking into the new Census data for Virginia, I cannot help but notice how well the state serves as microcosm for national trends, not only demographic trends but political trends as well. Stay tuned for more as I continue to delve deeper into the data and look into how demographics are influencing big political changes.


