The nation’s changing political topography
For 2012 election-related commentary, please see these recent posts :
- Forget Ohio, it’s all about Virginia…and demographics
- Virginia Votes 2012
- Virginia Votes 2012: Turnout across localities
- Lower turnout in 2012 makes the case for political realignment in 2008
After posting Climbing Mount NoVa in 2012 a few weeks ago, I had people ask to expand my scope outside of Virginia to the national level. Using county-level election data for the contiguous 48 states from 1980 to 2008, I now track the major vote centers and growth areas in the national electorate.
The electoral college system dictates that the only presidential election results that matter are at the state level. Yet, the growing urbanization of the country means that in order to win some states candidates must appeal more and more to constituencies in the cities and their sprawling suburbs. This phenomenon has been at play at least since the 1920s, when, for the first time, a majority of Americans lived in urban areas — due, in part, to the Great Migration of blacks moving from the mostly rural Jim Crow South to the cities of North. These demographic shifts changed the nature of the nation’s political parties. For instance, the growth of urban America was key in forming the New Deal coalition of blacks, laborers, and religious minorities that propelled Franklin Roosevelt to the Presidency.
Since the second half of the twentieth century to 2008, however, migration has shifted back toward the “Sunbelt” and to newly expanding cities of the South. Economic development, modernization, and advent of air conditioning played their parts in drawing people from the faltering “Rustbelt” economies of the North. As a result, the expanding metropolises of the Sunbelt have seen the greatest gains in electoral strength within their respective states.
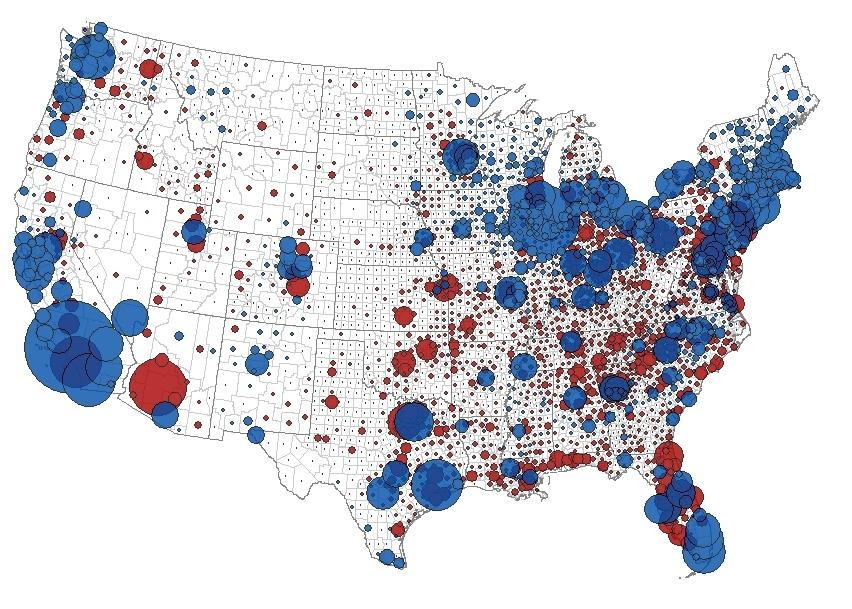
The graphic below (no longer shows some of these changes since 1980. Each bubble represents the size of the electorate (people who vote) in each individual county and the color represents the two-party victor (no third parties). Remember, counties vary wildly by geographic area and population — some of largest by land area and population are in Southern California and some major metropolitan centers, like New York City, are split between county jurisdictions.

Growth in Southern California, Miami, Phoenix, Dallas, Houston, and other areas of the Sunbelt has been the most dramatic. Many of the cities of the South have also grown more Democratic since 1980. As a result, the recent electoral college shifts and reapportionment of House seats to states in the South isn’t necessarily a boon for Republicans, as some have suggested. Much of the growth in the Sunbelt occurred in major, Democratic-leaning cities.
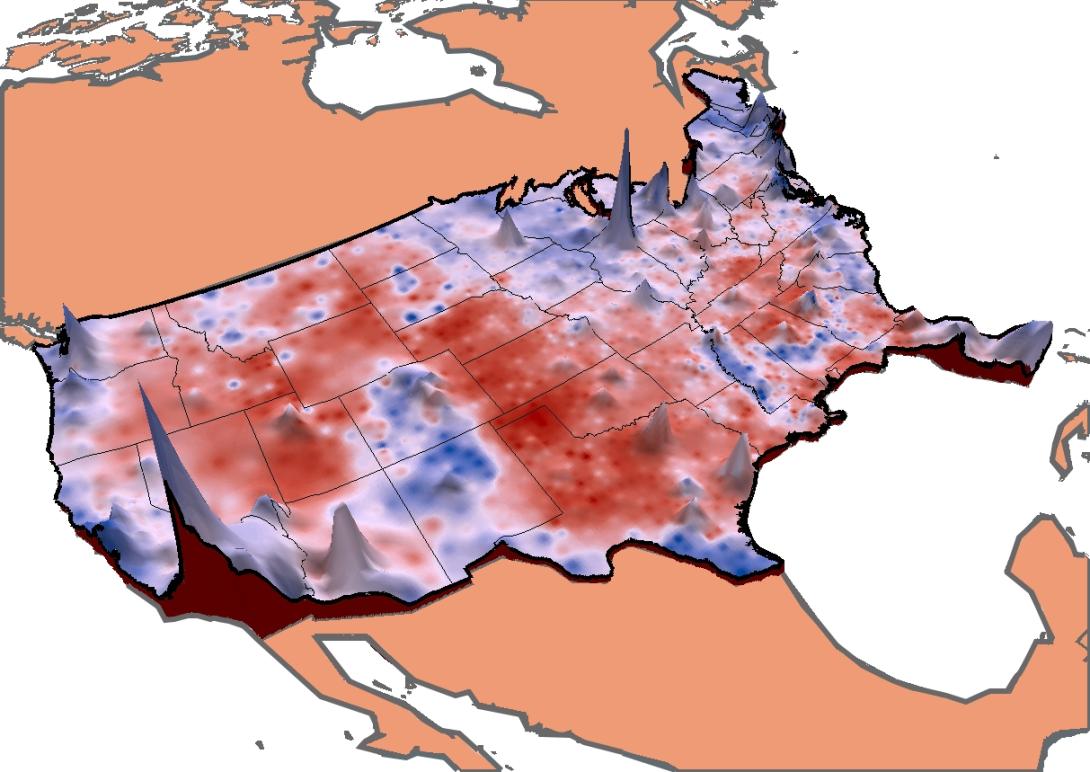
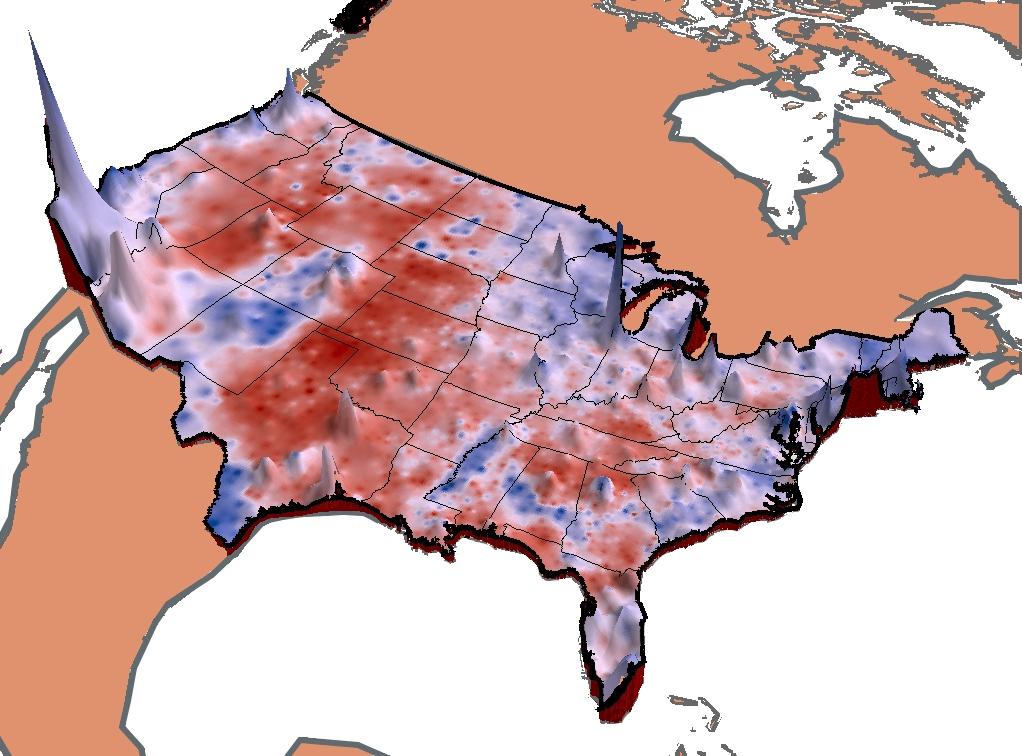
So what does the current political topography of the nation look like? Below are national heat maps displaying the county level results for the 2008 presidential election with elevation representing the number of voters.


Much like what we found in the Virginia example, the suburbs and rural areas of the county remain decidedly Republican. While Republicans can claim many high-peaks or large, high-density regions such as Phoenix or the Houston and Dallas metro areas, most of America’s high-density counties remain Democratic.
Demographers and futurists disagree on whether migration to sunbelt cities will continue well into the twenty-first century, especially after the most recent economic downturn. For instance, high growth areas such as Phoenix were especially hard hit by the housing crash and many families are fleeing Southern California. Some predict a resurgence of the heartland and suburbs with people moving into the Great Plains and Midwest due to low tax rates and costs of living. Others think that people will continue to move into the nation’s highest population density areas, or “mega-regions,” such as the Boston-New York-Washington corridor to take advantage of the social and creative capital that only high-density cities can offer.
It is impossible to predict what any of these scenarios might suggest politically. It is sometimes only well after the fact that we fully understand the role demography has played in the nation’s politics. What we do know is that it takes creative political leaders, like the Roosevelts, Johnsons or Reagans, to recognize and capitalize on trends that many may not be fully aware of.


