Why 2020 Census data needs to be treated with caution
It is difficult to name any data source that is more reputable than the U.S. decennial census data, which is collected every ten years. The enormous effort to collect the demographic information of every U.S. resident for the 2020 Census required half a million workers and a budget of over 14 billion dollars (more than the total funding provided to the National Weather Service over the last ten years). Yet, despite the vast amount of time and money spent on the census, much of the 2020 Census data released earlier this month will be difficult or impossible to use. This is due, in part, to disruptions to census operations as a result of the pandemic and, in part, to a series of decisions made by the Census Bureau to distort most 2020 data prior to releasing it.
To help data users process the 2020 census results, we will be analyzing 2020 Census data and sharing our findings, including important demographic trends that are clear in the data and some of the key problems we’ve identified in the data. One overall observation is that Census 2020 data tends to be more reliable for larger areas and populations whereas in Virginia’s smaller localities, data errors and distortions are much more common.
A clear takeaway, confirmed by 2020 Census data, is that Virginia’s population growth slowed considerably during the 2010s, increasing by less than 8 percent during the last decade. Since 1863 when Virginia’s current boundaries were set, the Commonwealth’s population has only twice grown more slowly than in the 2010s—during the Great Depression and during the Civil War. The 2020 Census also confirmed that Virginia’s population grew more slowly than the rest of the country during the second half of the 2010s, the longest period of time that Virginia’s growth has lagged the U.S. since before World War II.

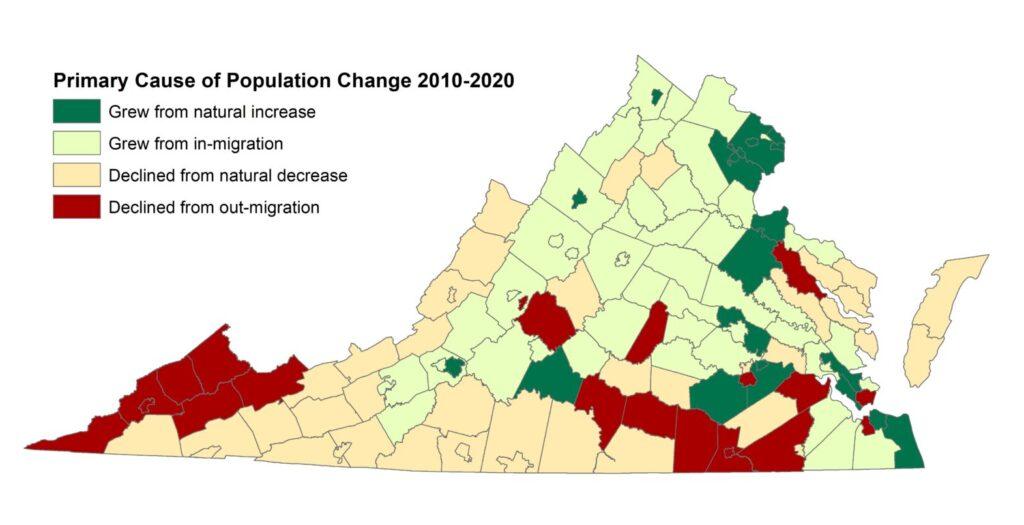
The slowdown in Virginia’s population growth was driven in large part by a shift early in the 2010s to more people moving out of Virginia than people moving in. An increase in deaths as a result of Virginia’s aging population and fewer births also helped slow growth. In 2007, Virginia had 50,000 more births than deaths, but by 2019 the difference had steadily fallen to 30,000.
Northern Virginia and Winchester remained Virginia’s fastest growing metro areas during the 2010s, with the population of both increasing by 14.4 percent. However, the two metro areas have also experienced the sharpest slowdowns in population growth, in large part due to an increasing number of Northern Virginians moving out of state. As a result, Northern Virginia only grew 6.5 percent faster than Virginia as a whole during the 2010s, down from 10.9 percent faster during the 2000s.

Natural increase or decrease = births minus deaths.
Slowing population growth has also meant more population decline, particularly in small counties with aging populations, where deaths typically outnumber births. During the 2010s, 50 of Virginia’s 95 counties declined in population, and 48 of the 50 declining counties had more deaths than births. In the 2000s, 22 of Virginia’s counties declined in population whereas in the 1990s only six of Virginia’s counties declined in population.
The problem with 2020 Census data
While some demographic changes are visible and reasonable in the 2020 Census data, particularly for larger areas and populations, in Virginia’s smaller localities, data errors and distortions are often more obvious than actual demographic trends. One example is the City of Radford, where the 2020 Census appears to be missing many of its residents. University students account for most of the city’s population but even though State Council of Higher Education data show that Radford University’s dorm population rose by over 1,000 during the period and its off-campus student population grew by more, the 2020 Census shows that the city’s population declined during the 2010s. Because Radford and other universities across the country stopped in-person classes and often encouraged students to leave in March of 2020, few students were available to be counted in Radford when the Census began on April 1st. Though the Census Bureau worked with colleges to obtain a count of students living in their dorms, thousands, perhaps tens of thousands, of students living off campus in Virginia’s college towns were not counted where they study and live most of the year.
Fortunately, in Williamsburg, the 2020 Census included a larger portion of William & Mary students than it did in Radford, but census race data for Williamsburg and many Virginia communities appear to be incorrect. The 2020 Census shows that the share of Williamsburg residents who identified as Black nearly tripled to 39 percent between 2010 and 2020. Census data places nearly all the growth of Williamsburg’s Black population in Census Blocks containing William & Mary dorms. However, data from the State Council of Higher Education shows no growth in the number of Black students at William & Mary living in dorms during the period.

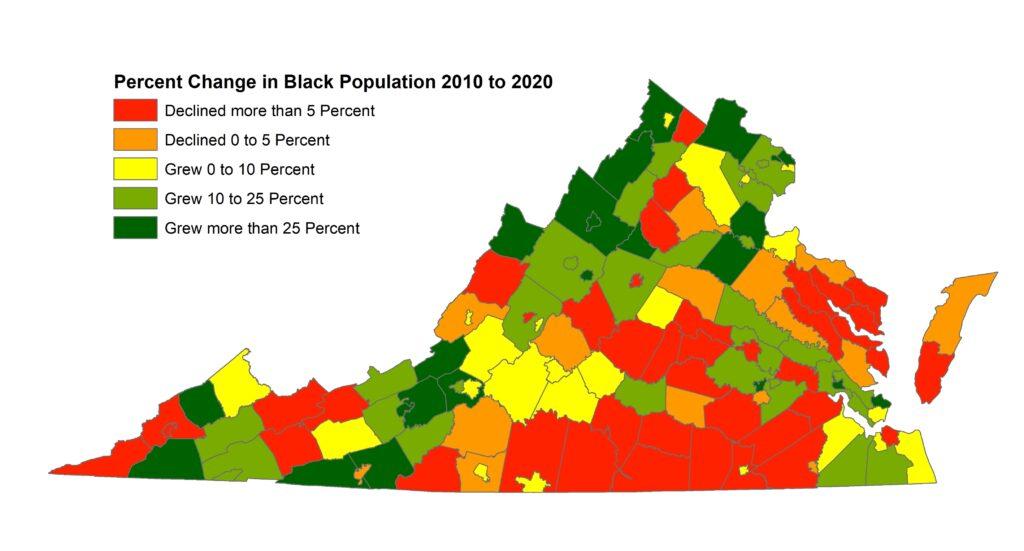
Why the Census reported the wrong race for thousands of Williamsburg residents is not clear but a likely cause is the Bureau’s decision to swap some census respondents’ identities with other respondents for privacy protection (called Differential Privacy). Before Census 2020 data was publicly released, demographers and others were permitted to view demonstrations of the data in which the Bureau’s new privacy algorithm had been applied. A pattern that arose from this data was a systematic shift of characteristics common in one community to another community where the characteristics were less common. An example of this in Virginia is the fairly dramatic shift of the Black population from Black-majority localities to localities with smaller Black populations. In localities where less than 2 percent of the population identified as Black in 2010, the Census 2020 data shows an average 74 percent growth in the Black population whereas in Black-majority localities, the 2020 data shows an average 6 percent decrease in the Black population. This shift is a result of applying the privacy algorithm to the data rather than the result of an actual demographic trend in the Black population.

Though it may seem odd to those who occasionally use census data, many, if not most, demographers are aware of the potential hazards in comparing data from any two censuses. Each census is conducted in different circumstances, sometimes with different questions, and even if the questions do not change, people often still change their responses from one census to another. Data from the 2020 Census will be particularly difficult to compare with data from previous censuses. But the biggest problem with the 2020 Census is that so much of its data appears suspect or clearly incorrect that little of it can be automatically accepted as fact.


