


Since the pandemic, young adults have fueled the revival of small towns and rural areas
In July 1979, President Carter nominated Paul Volcker to be Chair of the Federal Reserve with the task of ending one of the worst periods of inflation in the country’s history. In order to achieve this goal, the Federal Reserve steadily raised interest rates to historic levels, reaching 20 percent in 1981. Though Volcker ultimately succeeded in reducing inflation, it had many side effects. The ensuing recession, a strong dollar, and tax reforms accelerated the transition of the U.S. economy from manufacturing to a service-based economy. Manufacturing jobs, which peaked at 19.5 million in 1979, fell to under 11.5 million during the pandemic, while employment in finance and professional and business services soared from 12 million to 32 million. This economic shift brought with it a demographic realignment, with population growth concentrating in large metros where service industries thrived. While it remains uncertain whether we are now witnessing another such shift, Census data released over the summer shows that the demographic trends that have persisted this decade are unlike any seen since before 1980.
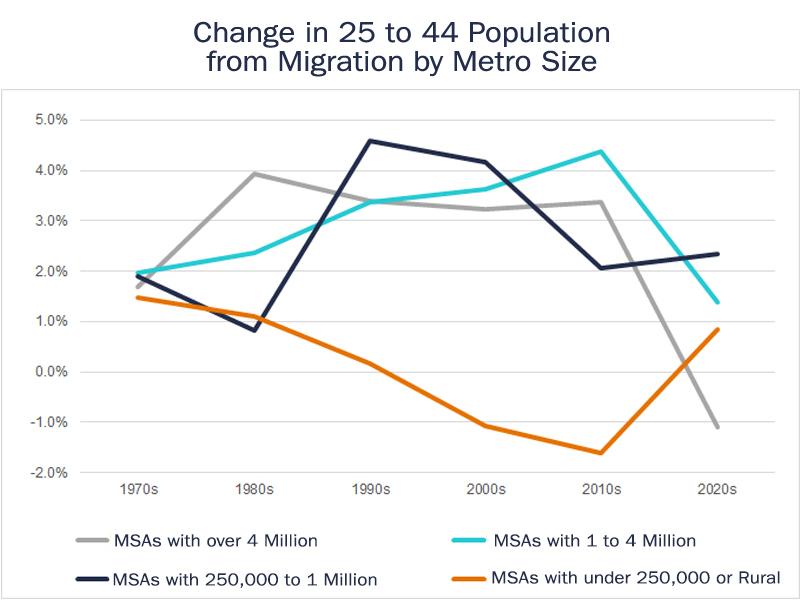
Source: Age-Specific Net Migration Estimates for US Counties, 1950-2020. Applied Population Laboratory, University of Wisconsin, Census Age Estimates. Migration rates for previous decades are over three year periods for comparison with 2020 to 2023.
In the decades prior to 2020, large metro areas drew an increasing share of young adults
In the decades that followed 1980, America’s large cities and metro areas grew more economically and demographically different from its small towns and rural areas. Unlike manufacturing plants, most white-collar service industries tended to cluster in the largest cities, such as Washington D.C. or San Francisco, where employers and employees could benefit from large networks of expertise and the rapid exchange of ideas. The influx of young white-collar workers into large cities since 1980, meant that in the following decades nearly 80 percent of the country’s growth in its under 45 population has been concentrated in metro areas with over a million residents. In contrast, in rural counties and small metro areas, the total population of those younger than 45 is smaller today than in 1980.
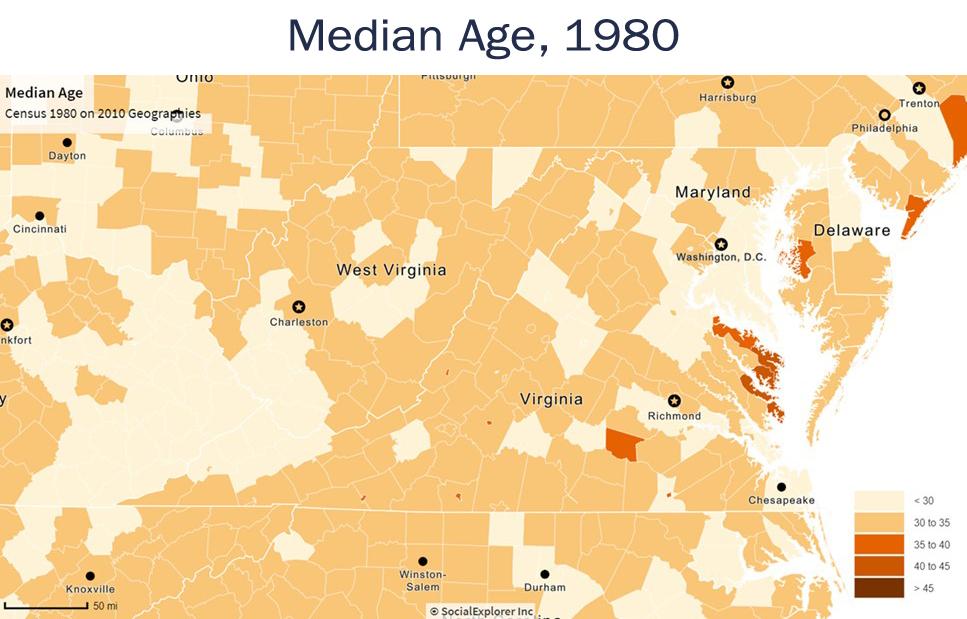
Source: 1980 Decennial Census Count
The migration of young adults to large metro areas for higher paying service jobs slowed the aging of many urban counties while it accelerated the aging of most of the rural counties they left behind. In Arlington County, Virginia, across the Potomac River from Washington D.C., the median age rose by just 2 years between 1980 and 2019, while in more than a third of Virginia’s counties, it increased by over 15 years. In 1980, the median age in 1,800 U.S. counties was within five years of each other; by 2019, this number had dropped to 1,342 as rural counties aged faster than the rest of the country.
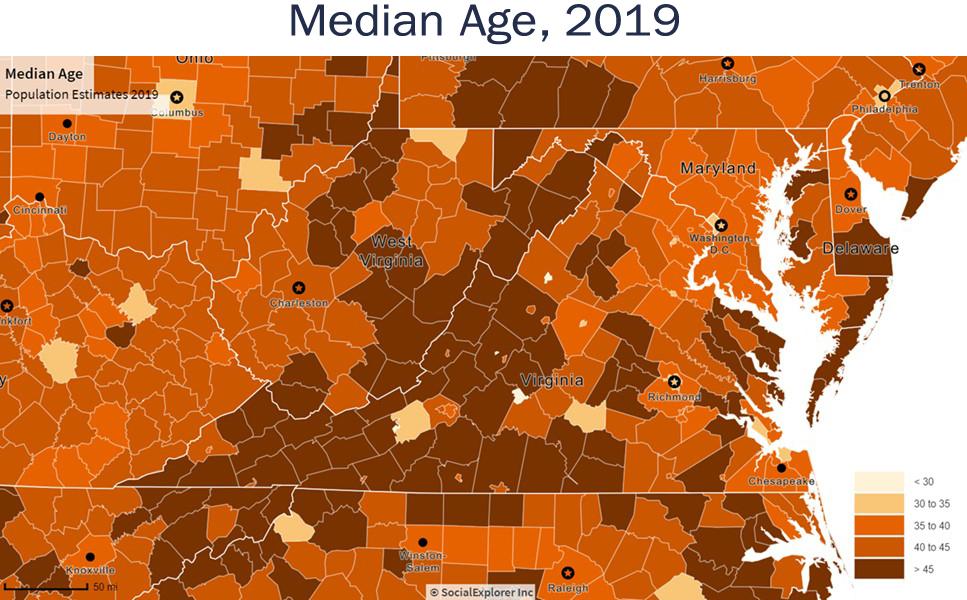
Source: Census Bureau 2019 Age Estimates
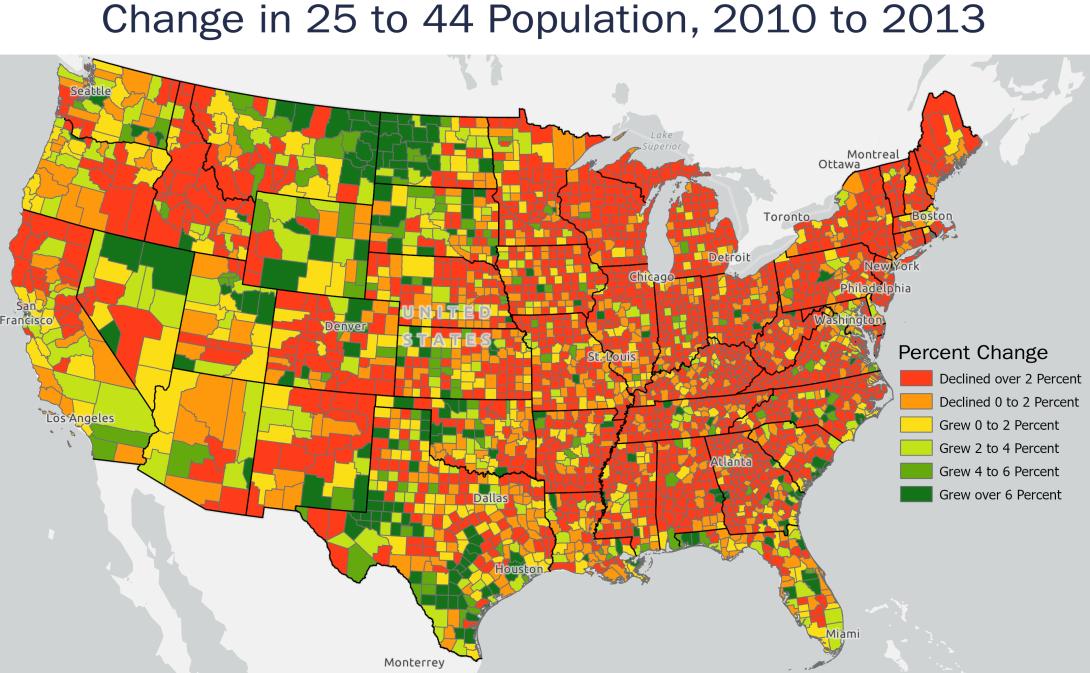
During the 2010s, the share of young adults moving from small towns and rural counties into large metro areas continued to increase, reaching its highest point in over half a century. In Arlington County, this influx led its population of 25- to 44– year-olds to grow faster than any other county within the country’s twenty largest metro areas. The migration of young adults from rural to urban areas caused communities to become increasingly unbalanced demographically. During the 2010s, Arlington County had six times as many residents between the ages of 25 and 44 as those over 65 years of age whereas in rural counties, the population over 65 frequently exceeded the population between 25 and 44. In Highland County, along Virginia’s western border, its population over 65 was twice the size of those between 25 and 44. As the 2010s progressed, the demographic and economic trajectories of most rural and urban regions appeared to be heading in different directions, increasing the divide between them.
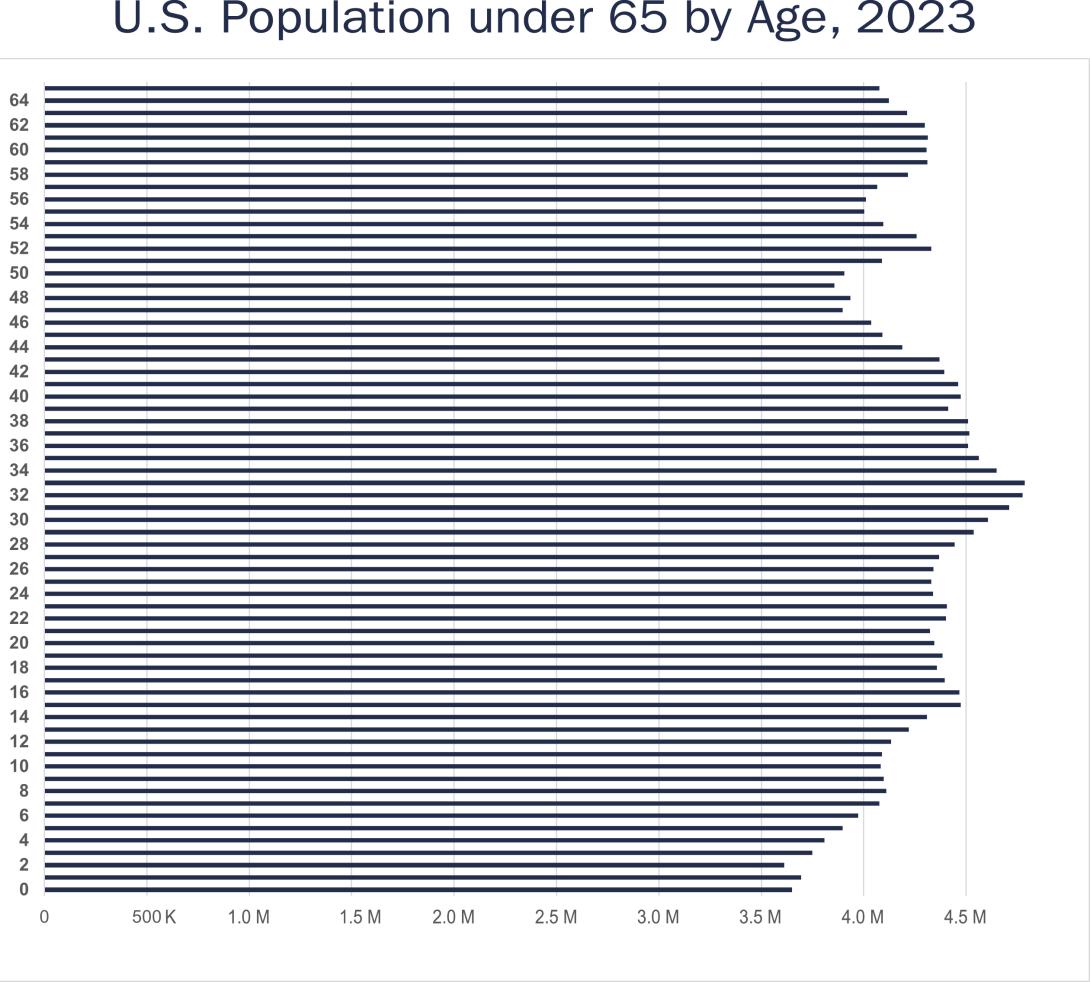
Census Bureau, 2023 Age Estimates
Heading into the 2020s, the demographic divide between large cities and rural areas was expected to widen further as the labor supply tightened and large metro areas intensified their efforts to sustain workforces. Since 2007, the number of births in the U.S. has steadily declined meaning that after 2025, even if the country experienced a baby boom this year, the number of Americans turning 18 will continue to decline at least until the 2040s. In a competition for a shrinking supply of young workers, large metro areas were positioned to continue attracting the large majority of young workers.
Since 2020, small towns and rural areas have become the top destination for people moving within the U.S.
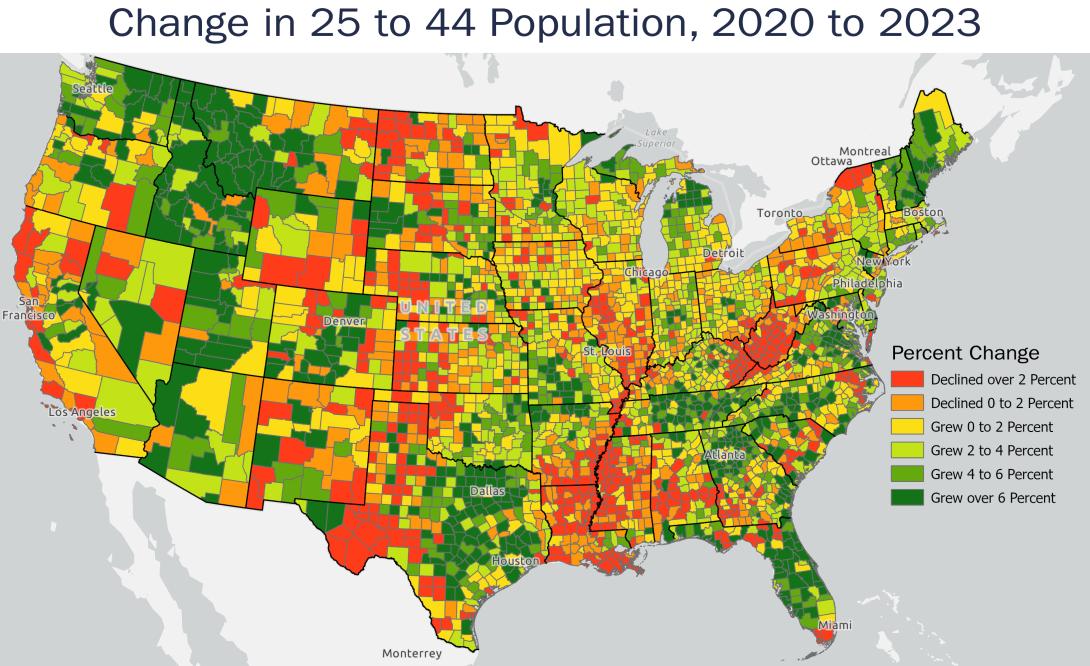
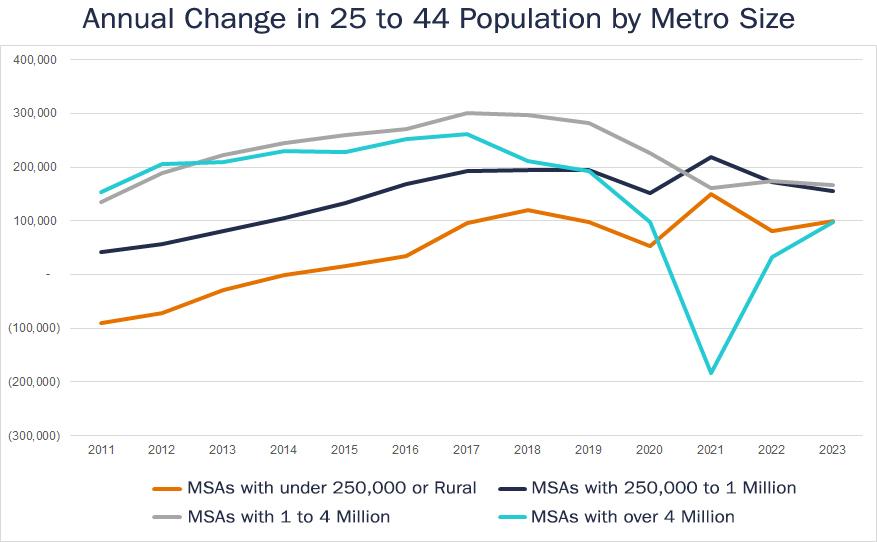
So far the 2020s have turned out very differently than any recent decade. The 2023 county population estimates released by the Census Bureau this spring showed that last year migration rose in small towns and rural counties, making them the top destination within the U.S. The 2023 age estimates, which the Census Bureau released over the summer, show that most of the growth that small towns and rural areas have experienced since 2020 is being driven by growth in their population of 25- to 44– year-olds. Perhaps the most striking statistic within the 2023 age estimates is the fact that since 2020, the country’s small towns and rural areas have been attracting younger adults at the highest rate in nearly a century. Since 2020, two-thirds of growth in the 25 to 44 population has occurred in metro areas with fewer than one million residents or in rural counties, a stark contrast to the last decade, when 90 percent of this growth was concentrated in the largest metro areas with over four million residents. Instead of returning to pre-pandemic trends, the migration of younger adults into rural counties and metro areas with under a quarter million residents accelerated last year.
Source: Census Bureau, Annual Age Estimates
The scale of the demographic shift since the last decade is remarkable. During the first three years of the 2010s, only 27 percent of counties in rural and small metro counties saw an increase in their 25 to 44 population. So far this decade, that figure has risen to 63 percent, even though the country’s 25 to 44 population grew at a similar rate in both time periods. In rural counties where the younger half of the workforce continues to shrink, the economy often remains tied to an industry with declining employment, such as coal mining in Southern Appalachia or oil drilling in North Dakota’s Bakken Basin. Many of these counties also lack the natural amenities that attract young adults. This decade, the 25 to 44 population has declined in counties with the lowest USDA natural amenity scores, which are determined based on each county’s landscape and climate. On the other hand, in rural, often remote counties with high amenity scores, like Chaffee County in the Colorado Rockies and Union County in the Blue Ridge Mountains of Georgia, the younger workforce has grown at twice the national rate.
Source: Census Bureau, Annual Age Estimates
Just as younger adults have increasingly migrated to rural counties with high natural amenities, the incomes of new residents in these areas have risen sharply since the pandemic. IRS data from 2021 and 2022 shows that in counties with the highest natural amenity scores, incomes of new residents have grown three times faster than the national average since 2018 and 2019. In contrast, counties with the lowest scores saw income grow at only half the national rate. In Virginia’s remote Allegheny Highlands, Highland County saw a 68 percent increase in new residents’ incomes after 2020, the third highest in Southern Appalachia. Neighboring Bath County, with the highest natural amenity score in Virginia, experienced the largest income growth among new residents in Southern Appalachia.
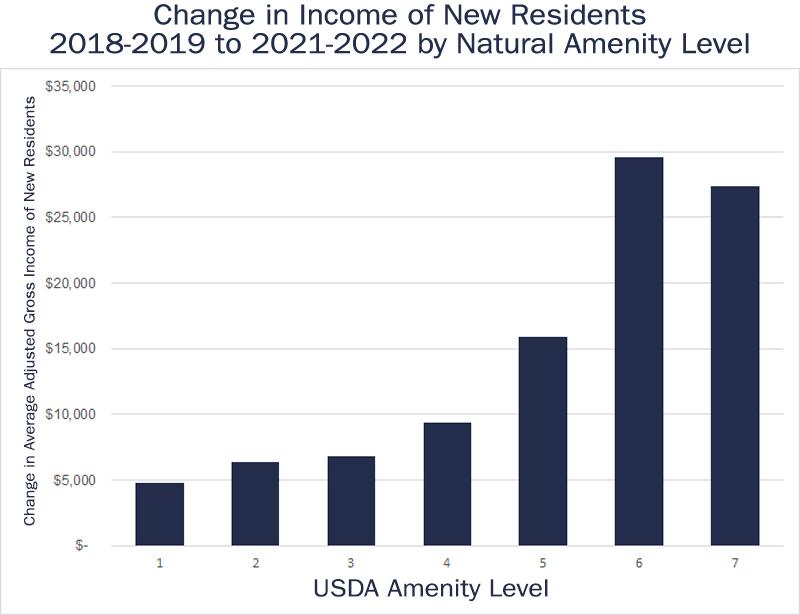
Source: Internal Revenue Service, Annual Migration Estimates
Zoom towns may have appeared to be a temporary pandemic trend experienced by a few small towns, but the ongoing growth in young adult populations in most rural counties and the accompanying rise in incomes among new residents suggest that remote work and a tight labor market are continuing to allow many workers to have far more geographic flexibility in where they live. This shift has coincided with increased economic activity in many rural counties and small towns. Between 2019 and 2023, IRS applications to start new businesses in the country’s smallest metro areas and rural counties increased 13 percent faster than in other parts of the country. Counties with higher USDA amenity scores saw the most significant growth in new business applications. In Virginia, rural communities along the Chesapeake Bay led the state with a 33 percent faster increase in new business applications compared to the state average, followed by Southwest Virginia at 21 percent. In contrast, counties in Northern Virginia, the state’s wealthiest and most populous region, saw slower growth in business applications.
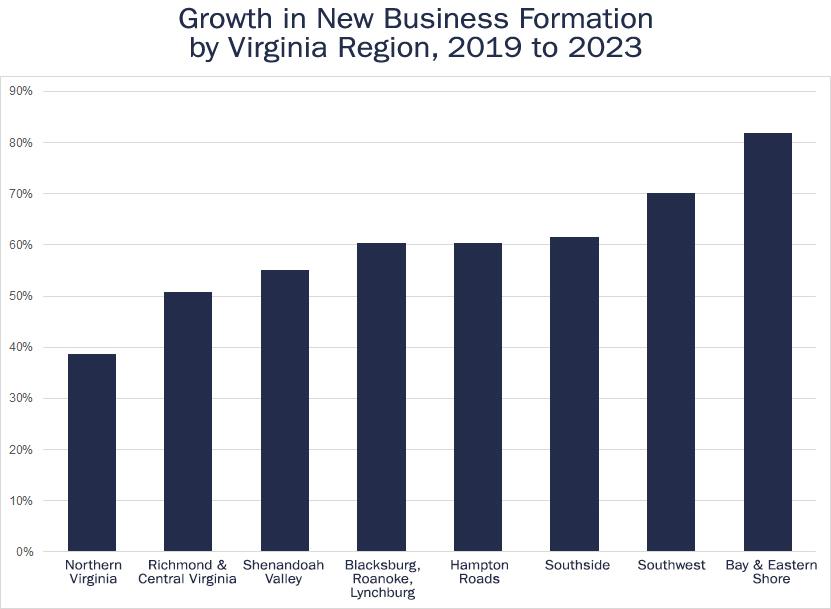
Source: Business Formation Statistics produced by the Census Bureau using Internal Revenue Service data
Although the pandemic and the explosion in remote work in 2020 accelerated migration to small towns and rural counties, several underlying trends were already contributing to a broad transformation of much of small town and rural America. By 2017, rural counties had begun to attract more residents aged 25 to 44 than they were losing, reversing earlier declines. Meanwhile, in high-cost metro areas such as Los Angeles, New York, and San Jose, their younger workforce had already begun contracting before 2020. Although median incomes for younger adults only recovered to pre-recession levels in 2017, the booming economy of the late 2010s made moving further from major job centers more financially feasible. Rising housing prices in large metro areas also made more affordable small towns increasingly attractive. In 2022, the homeownership rate for adults aged 25 to 44 in small towns and rural counties was only 2 percent below its 2005 level, while in larger metros, it remained 8 percent below 2005 levels.
Source: Census Bureau Annual Age Estimates
As workforce growth stalls, attracting young adults will grow more vital for communities
The exodus of younger adults from most large metro areas since the pandemic has tightened their labor supply, making it harder for many companies to expand or fill vacant positions. This labor shortage is expected to worsen after 2025 as the number of Americans turning 18 begins a multi-decade long decline. In the long term, the sharp decline in birth rates in urban counties will further strain their labor force. An analysis of Census Bureau 2023 Age Estimates by the Economic Innovation Group showed that the out-migration of families and lower birth rates have caused the population under age five in large urban counties to shrink twice as fast as the rest of the country since 2020. Arlington County, Virginia, has experienced one of the sharpest drops in its 25 to 44 population among urban counties since the pandemic, coinciding with a 24 percent decline in births since 2015, compared to less than 7 percent in the rest of Virginia. Although most small towns and rural counties have seen their labor force stabilize from an influx of younger adults, after 2025 the steady decline in the number of Americans turning 18 will make it more difficult for the workforce to grow in every part of the country.
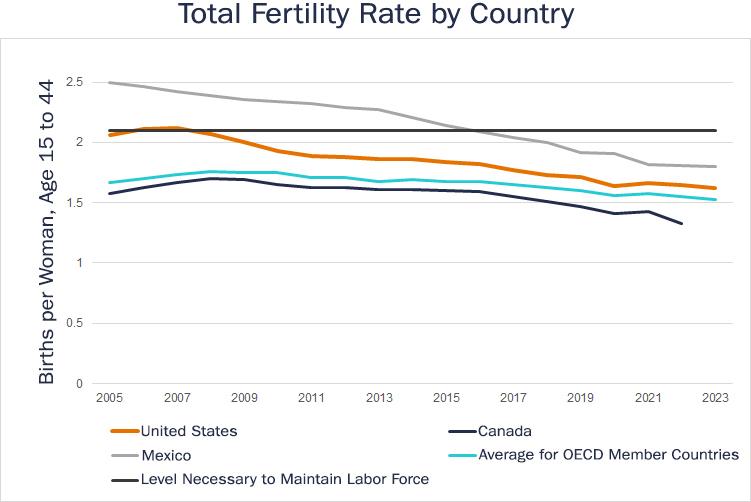
Source: OECD Data Center
Even before the pandemic, the U.S. workforce was set to undergo a transformation as the number of 18-year-olds began to decline after 2025. While the pandemic didn’t change this trajectory, it does appear to have significantly reordered which regions will be most affected by a tightening labor supply and which will attract workers. If remote work remains much more widespread than before 2020 and labor markets stay tight, the 2020s are likely to offer workers more geographic flexibility than in any recent decade. The Census Age Estimates suggest that communities with enticing amenities (particularly affordable housing) rather than only major job centers, will continue to attract younger adults—a marked departure from previous trends.