


National 50-state population projections: 2030, 2040, 2050
Benchmarked on the 2020 Decennial Census Count data, our latest round of National Population Projections provides a look into the demographic future (total population, broken down by age and sex) for all 50 states and the District of Columbia over the next few decades of 2030, 2040, and 2050.
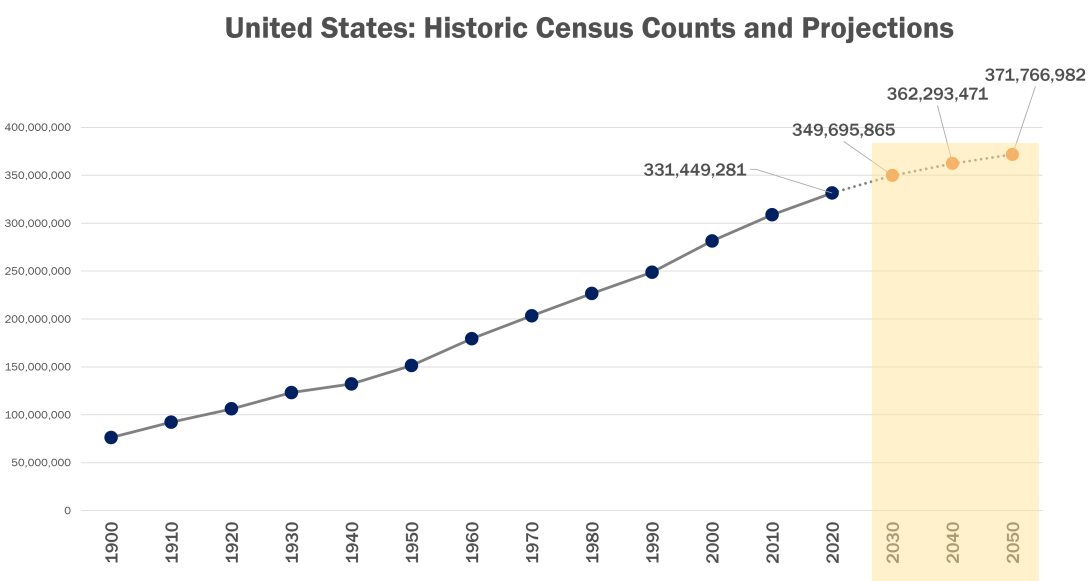
National Population Change
Between now and 2050, the overall population of the United States is expected to increase, from 331 million in 2020 to 349 million in 2030 and 371 million in 2050. In continuation of the well-established trend of slowing growth rates, we may see the national rate of growth decrease from nearly 10% in 2000-2010 to 7.4% over 2010-2020 to an anticipated 5.5% over 2020-2030. Most states will also experience similar deceleration as per the projections. This pattern can be partially attributed to the lower level of immigration as well as the accompanying lower birth rates and older age profile over the recent decades.
The change in the total U.S. population is of course not uniformly distributed across all geographies. This variation can be demonstrated in multiple ways, by regions and by states.
Regional Shifts
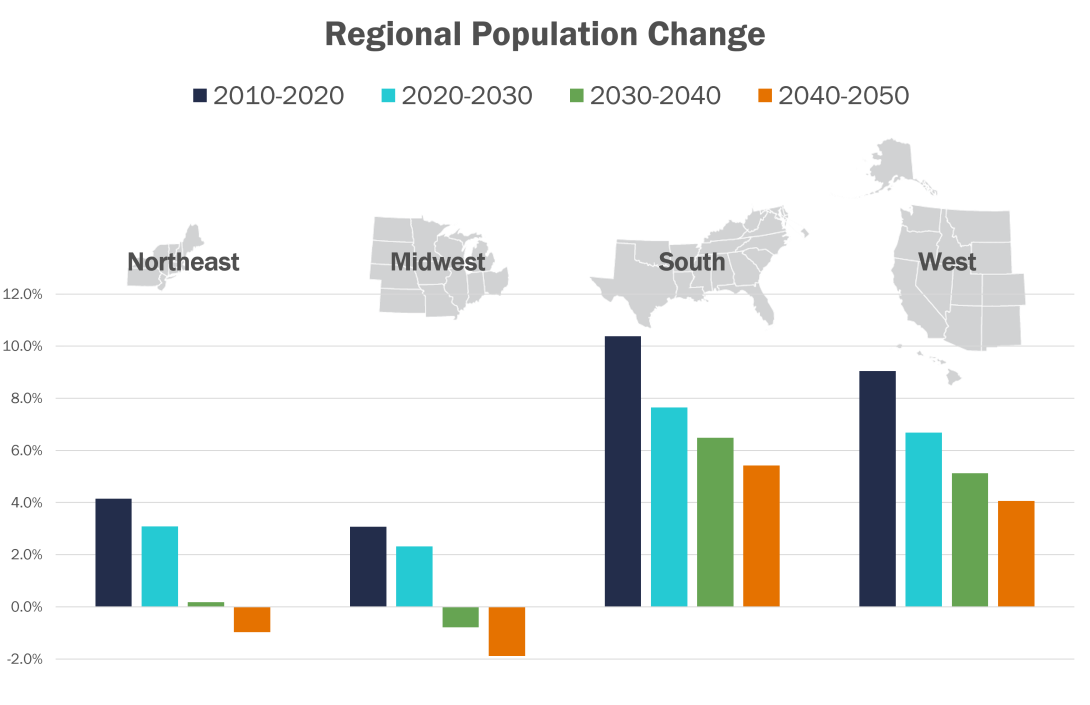
A comparison across the Census Bureau defined regions reveals that population growth over the next several decades is expected to continue to move towards the South and West, with both regions experiencing 6-8% increase in the current decade until 2030. Between 2040-2050 the Northeast is expected to see a slight population decline, whereas the Midwest is expected to shrink even earlier and see negative population change over 2030-2040.
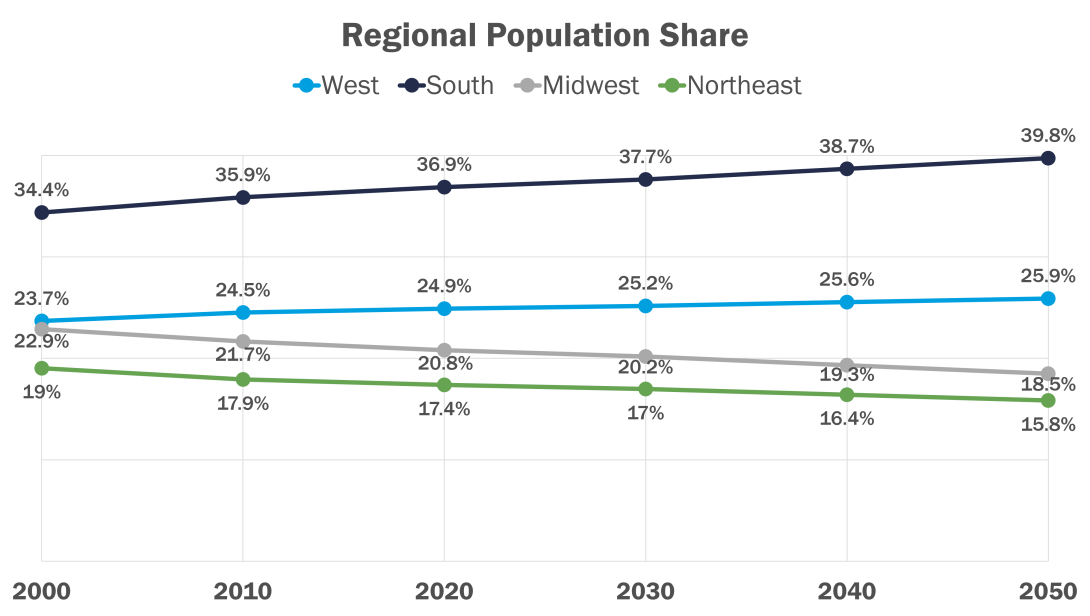
The population movement to the South and West is supported by the change in percentage distribution of the U.S. population by each region since 2000. The regional population shares clearly show the persistent decline for the Northeast and Midwest, while there is a steady uptick for the South and West (see figure below). This southwestern shift is also evident in the evolution of the state rankings by total population size with California, Texas, and Florida dominating the charts from 2020 through 2050 and occupying the top 3 spots consistently.
State-by-State Trends
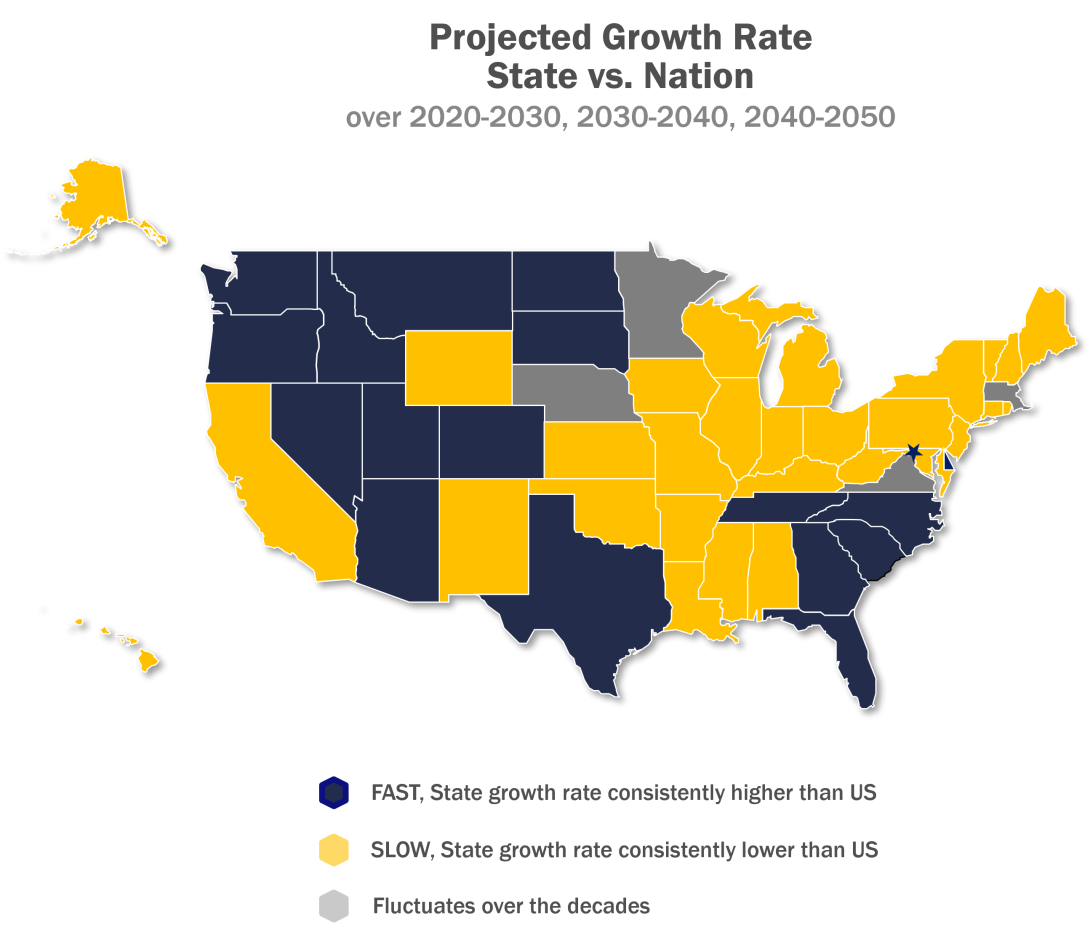
Comparing each state’s decadal growth rate to the nation’s shows that 29 states (in yellow) have growth rates that are consistently lower than the national population change till 2050, while 18 states or state-equivalent (in deep blue) will grow faster than the U.S. average.
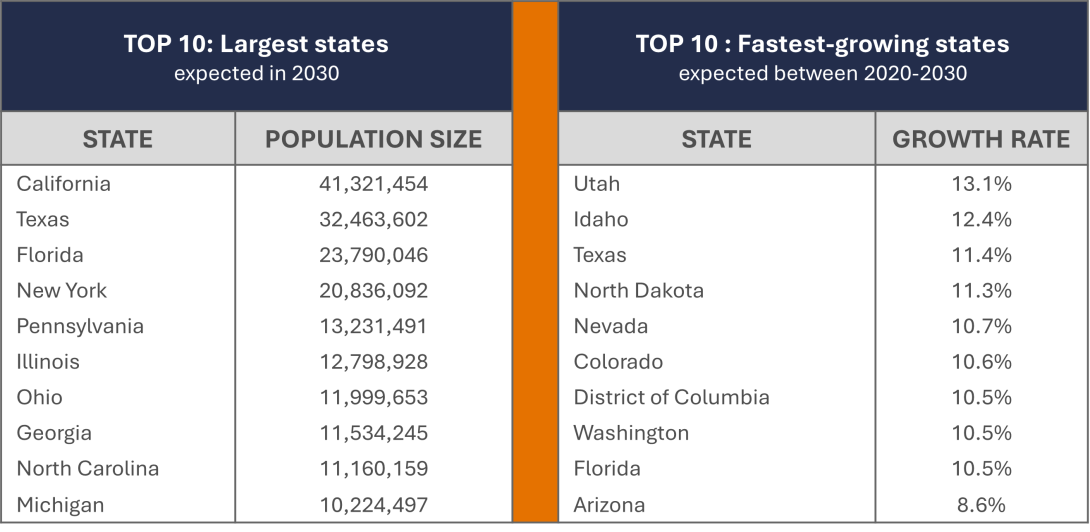
The top 10 largest states are projected to remain the same from 2020 through 2040, with some re-ordering in their relative ranks as Georgia and North Carolina gradually move up, and by 2050, Washington is expected to be the 10th largest state, replacing Michigan in the list. Over the next few decades, California, Texas, Florida, and New York will hold their positions (see table below) and together be home to over a third of the future U.S. population.
While most states will continue to grow, some are projected to see a consistent decline over the next few decades, such as West Virginia, Mississippi, and Illinois.
Provided the observed trends continue, the fastest growing states will also remain the same over the next 3 decades, with Utah, Idaho, and Texas topping the list.
Age Distribution
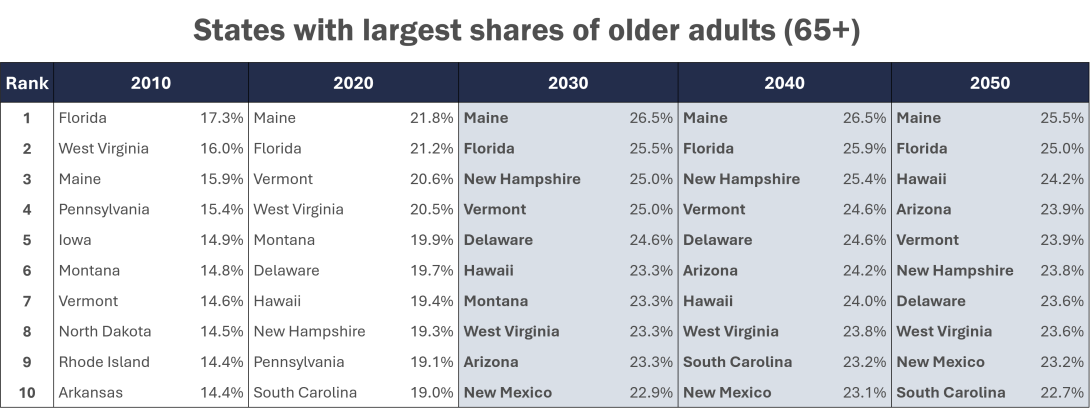
Finally, the age composition is fundamental to understanding how the population profile will develop over time. As the U.S. grows both in size and in age, its population is not just getting larger but also older. By 2030, one in five people, or more than 20% of the population will be over 65 years of age; this amounts to about 71 million older Americans. In Maine, Florida, New Hampshire, and Vermont, nearly a quarter of the population within each state is expected to be over age 65 by 2030.
The national median age is also going up gradually, from 38.78 years as per the 2020 Census to over 40.01 years by 2030. This means nearly half the country’s population will be in their 40s and older. Maine is projected to have the highest median age through 2050, while Utah will have the lowest.
To learn more about how these projections were developed, or to download the data directly, please visit our National Population Projections webpage.
It may be of value to mention here, that our projections series is independently developed and uses only past Census Count data as input. Late last year, the U.S. Census Bureau released their National Population Projections 2022-2100 for the country as a whole. Despite different input data, assumptions, and modeling, the 2030 projections for U.S. total population from the Weldon Cooper Center 2024 Vintage is within 1.32% of the Census Bureau’s 2023 Vintage.
Additionally, by projecting for all 50 states and D.C., the Cooper Center numbers serve the main purpose of providing a relative ranking across individual states with respect to their population characteristics, over subsequent decades. This comparability is possible due to the application of a consistent methodology for all 50 states, with no state specific assumptions being made, and the trends from the input data being allowed to play out organically. The 10-year projection horizons are set to April 1st for comparability with the Decennial Census snapshot.
----------------------
End Notes
- Projections are subject to uncertainty and need to be periodically updated with latest trends and input data for better accuracy.
All projections are subject to uncertainty and represent just one set of scenarios from a wide range of possible futures. This vintage of 2030, 2040, 2050 projections for all 50-states and D.C. are benchmarked on the 2020 Census data, and the components of population change (fertility, mortality, and migration) are incorporated via the Hamilton Perry reduced form of the cohort component method. However, there may be future fluctuations amongst the main drivers of population change. For instance, both international and domestic migration patterns have been evolving (lower immigration, higher remote work/telecommuting) since 2020, especially in the post-pandemic period; this will further affect population distribution among the different states. The next round of projections will be able to better capture the long-term impact of some of these changes. Projections from alternative sources can co-exist; different models have different merits.
Different projections series are built on different assumptions, input data, and methodologies; they may also serve different purposes. There are several other sources of population projections at the national level, such as the U.S. Census Bureau or the Congressional Budget Office. We recognize that several individual states do consistently develop and produce their own population projections, though usually they all have independent data release cycles and their methodologies often vary widely. Also there are some cases where due to resource constraints the state’s data production schedule may be less than regular.The value added of this 50-state data series is that we use a uniform methodology consistently across all states, make no special adjustments, and allow the state specific trends from the Census data to play out. This offers an apples-to-apples ranking and allows the projections to be comparable across all states.
- Utility and data quality of past projections
Over the last decade we released 3 vintages (2013, 2016, and 2018) of national projections, and found the data to be widely used and well received. These state-level projections have been cited by a diverse range of data users and organizations nationwide, including many federal agencies, state legislatures, businesses, non-profits, think-tanks, academic institutions, and the media. We also evaluated the accuracy of the 2020 projections with the Census Count, and this testing provided us confidence in the validity of our modelling techniques and ensured our data product was reliable for practical applications.