COVID-19 becomes the 3rd leading cause of death in the United States
For most of the last decade, the leading causes of death in the U.S. have remained the same, and the steady increase in mortality over the years has been largely due to an aging population. But the 2020 death statistics will be different. With over 300,000 deaths projected by end of Dec 2020, COVID-19 will become the third most common cause of death in the U.S.
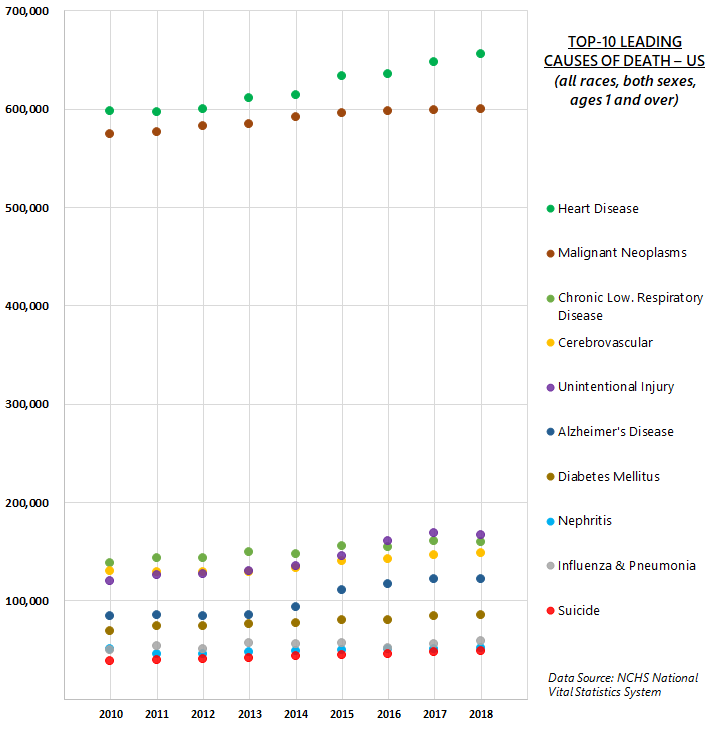
Figure 1 below shows the leading causes of death from 2010 to 2018, representing the population ages 1 and over. In 2018, for instance, a total of 2.8 million deaths were registered in the U.S. and the top-10 leading causes of death accounted for nearly three-quarters of all deaths. Heart disease and cancer (malignant neoplasms) remained on top of the list and surpassed the other causes by a large margin, accounting for more than 655,000 and 599,000 deaths respectively; accidents (unintentional injuries) were the next most common cause, resulting in about 166,000 deaths. Incidentally, influenza and pneumonia (combined into one category) has also consistently been in the list of top-10 causes of death.
However, 2020 will be a different story. With the current death toll at 239,000, COVID-19 has now become one of the leading causes of death in the U.S. The prolonged presence of the disease may be causing pandemic fatigue among Americans, but still more deaths are expected to be recorded in the near future. The COVID-19 fatality projections produced by the Institute for Health Metrics and Evaluation (IHME) for the U.S. demonstrate different scenarios, including easing of restrictions or mandatory mask usage. They predict the baseline at about 326,000 cumulative deaths by year end and nearly 400,000 lives may be lost by Feb 1, 2021.

The age distribution of a population also plays a role in determining its mortality profile, as seen in Figure 2, where the leading causes of death for 2018 are dis-aggregated by age. The youngest age category is for infants under 1, for whom congenital malformations, deformations and chromosomal abnormalities (congenital anomalies) make up the leading cause of death. For ages 1-44, accidents or unintentional injuries is the most common cause of death; between ages 45-84 majority of deaths were due to cancer (malignant neoplasms); and for the population aged 85 and over, the leading cause of death was heart disease.

A general pattern emerges: For younger age groups, more deaths are due to external causes like accidents, homicides, and suicides; and for older adults there is a greater prevalence of chronic diseases, such as heart disease and stroke, as well as Alzheimer’s and Parkinson’s. Additionally, the provisional COVID-19 death data indicates that the elderly and those with underlying health conditions are the most vulnerable.
Another notable observation is that across all ages, influenza and pneumonia is the eighth leading cause of the death, and it consistently ranks among the 10 major causes of death within the age-matrix, affecting all age groups from children to older adults (highlighted by boxes). While both are contagious respiratory illnesses, the seasonal flu is quite different from COVID-19. Even though the seasonal flu is often discounted as minor and manageable; it is a significant contributor to the leading causes of death and should serve as an important reminder to the public of the detrimental power of infectious respiratory diseases in general, and the lethal nature of the COVID-19 pandemic in particular. Also perhaps this year as a byproduct of wearing masks, practicing social distancing, or greater awareness of flu shots (vaccinations), the number of deaths due to influenza and pneumonia may see a decline, causing a reordering of the top-10 leading causes.
In addition to the fatalities directly associated with COVID-19, the 2020 statistics will also show more deaths in the other major categories due to the ripple effect from the pandemic, which has caused disruptions in healthcare services, disconnection from the community, and depression. A recent study found at least two-thirds of the excess deaths (defined as the number of persons who have died from all causes, in excess of the expected number of deaths for a given place and time) between late January and early October 2020 can be attributed to COVID-19, be it directly, in conjunction with a comorbidity, or via indirect causal connections. This summer recorded higher than usual numbers of deaths related to Alzheimer’s and dementia compared to previous years, partly due to the enforced social isolation and disconnection that resulted from the pandemic. Other patients, who, for example, suffer from heart disease or stroke may miss routine treatment or even emergency care in order to avoid exposure to COVID-19, which in turn may lead to additional deaths. Side effects of psychological stresses and economic recession may include adverse mental health outcomes, increased substance use, and elevated suicidal ideation, which could result in loss of life. The collective effect of all these secondary consequences may increase the death toll overall.
Once the 2020 data becomes finalized and available, in subsequent blogs, I hope to focus on Virginia’s death data and examine the impact of COVID-19, including:
- Excess deaths caused directly by COVID-19 by age, gender, and race
- Excess deaths by other leading causes of death by age, gender, and race
- Geographic distributions of all excess deaths
Data Source: Centers for Disease Control and Prevention WISQARS
Notes: Cause-of-death ranking is a standard tool for presenting mortality statistics and is useful in illustrating the relative burden of cause-specific mortality, but it must be used cautiously with a clear understanding of the limitations underlying the method. Rankings do not depict cause-specific mortality risk as depicted by mortality rates. Further explanation available in the National Vital Statistics Report.


