


Census 2020 Analysis-Virginia’s Age and Sex Distribution over the Past Decades

Between 2010 and 2020, the population in Virginia increased by over 630,000 people, reaching 8.63 million by 2020. Examining this growth through the lens of age distribution provides interesting insights into the present population structure.
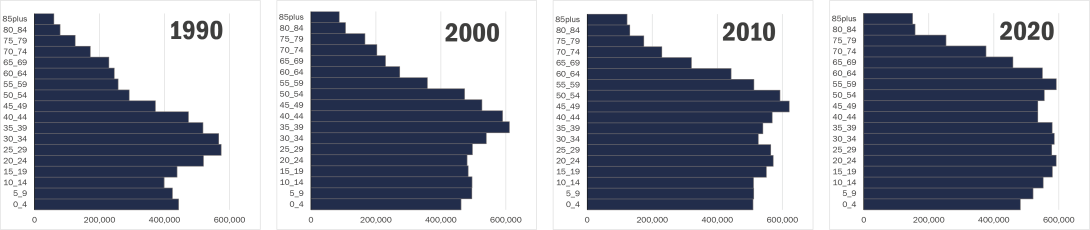
The age-profile, disaggregated over 18 age-cohorts (0-4, 5-9,…. 80-84, 85+), has been gradually evolving over the last 3 decades so that the 1990 age-structure looks quite different from that in 2020 (evident in the panels above). Aging of baby boomers, lower births rates, delayed child bearing, longer life expectancy, and recent decline in migration and immigration, have all contributed to the changing population structure. Over time, the baby-boomers and echo-boomers have progressed upwards on the age bar-chart, filling out the upper and lower-middle sections, to form a more mature and stable population structure for Virginia.
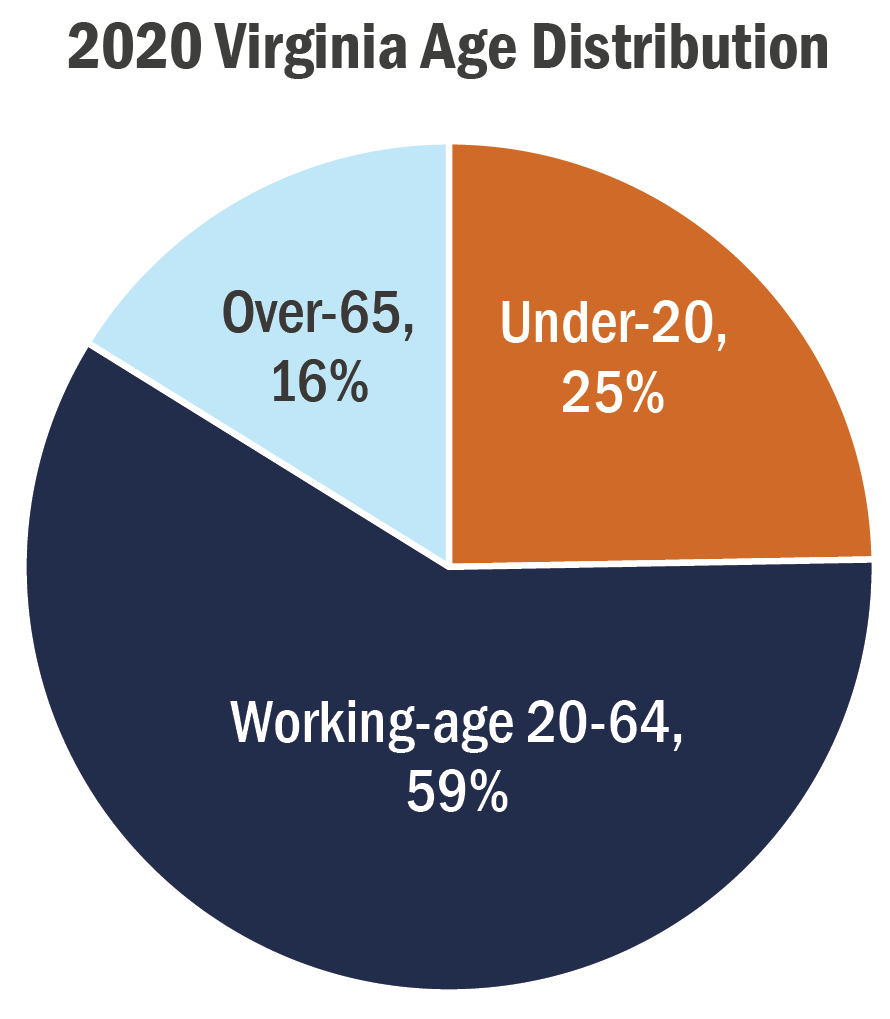
Another way to observe this evolution of the age-structure is by comparing the three main age-brackets: 1) younger cohorts aggregated to those under-20; 2) working-age cohort of 20-64 years; and 3) older-age cohorts of over-65. Over the successive decades, though the total number of the youth (under 20 years of age) and those of working-age (20-64) has risen, their shares in the total population are shrinking. In contrast, older Virginians—ages 65 and over—have seen steady growth, in both their population share and size. As per the 2020 Census, the younger cohorts make up only a quarter of the population in Virginia (or 2.1 million people), and this share has been steadily declining over time, since 1990. The share of the statewide working-age (20-64) population in Virginia is also lower at 59% (for a total population of 5.1 million), compared to 62% in 2010. Virginia’s over-65 population has grown to nearly 1.4 million and their share has increased to 16%, so that now approximately 1 in 6 Virginians is part of the older age cohort.
Examining the age distribution for the 133 individual cities and counties in Virginia yields some interesting findings:
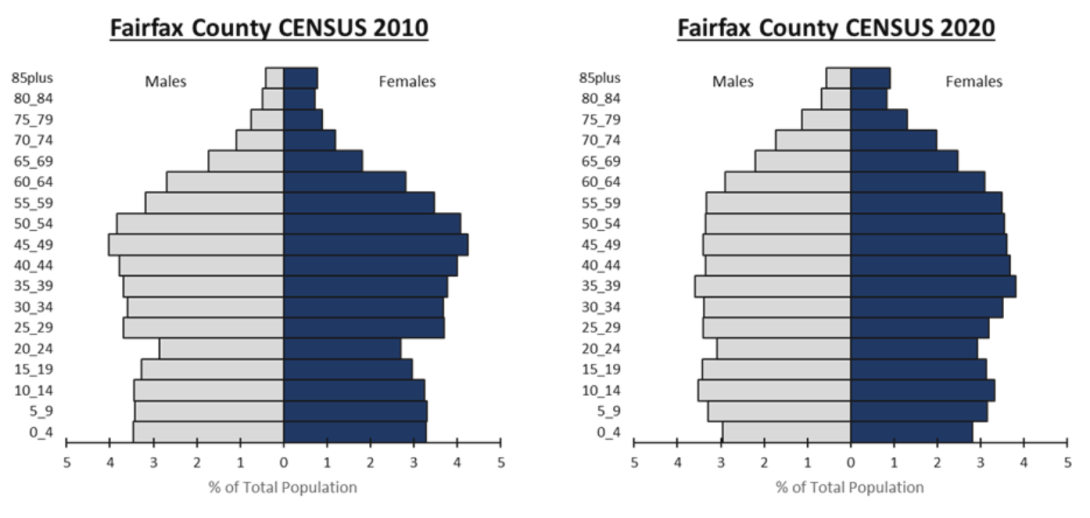
- Fairfax County has both the largest number of older adults (158,687 are over-65) and the largest number of young people (294,275 people are under-20), which could be attributed to the fact that it is the largest locality in the state.
- Both Harrisonburg City and Loudoun County have younger age profiles across all localities: 31% of their respective populations are under age 20.
- Both Lancaster County and Northumberland County have older age profiles across all localities: 38% of their respective populations are over age 65.
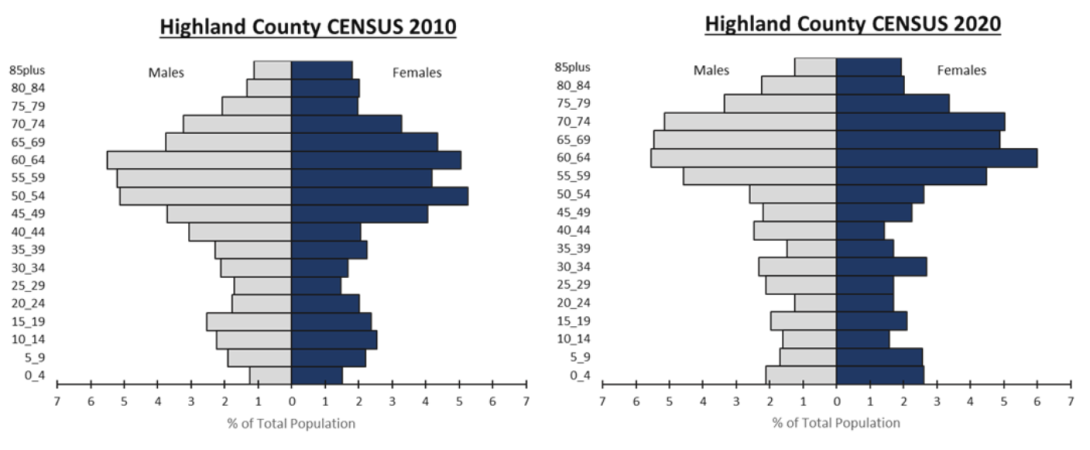
Finally, the following population pyramids1 provide a good representation of the age-sex composition of select localities in Virginia, and highlight the differences between 2010 and 2020.
Largest locality: Fairfax County has the largest population size in Virginia, with over 1.15 million residents in 2020. Its theoretical age-sex pyramid structure is becoming more barrel shaped, fueled by an aging baby-boomer generation and declining birth rates.
Smallest locality: Highland County, with 2,232 people, is Virginia’s smallest locality. It has a top-heavy population pyramid with middle-aged and older cohorts making up a large segment of the resident population; while the younger cohorts account for a relatively smaller portion of the population – as is apparent from the narrower base of the pyramid.
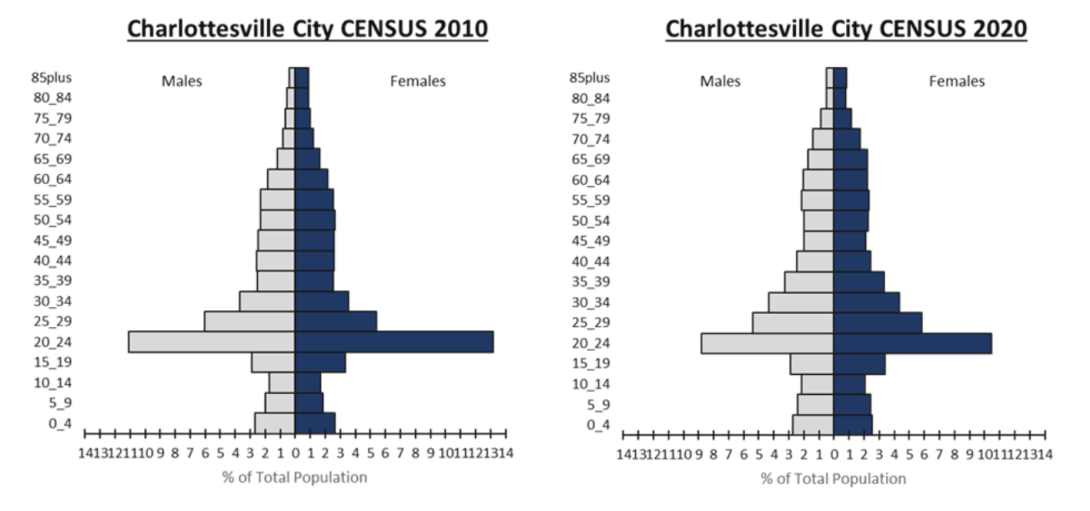
College town example: Home to the University of Virginia, Charlottesville City and Albemarle County provide good examples of a typical college or university town. Both of their population pyramids have a relatively narrow base and top, but with a greater concentration of those in the college going cohorts, ranging in age from the late-teens to those in their early to mid-twenties. Charlottesville has a large 20-24 cohort, while Albemarle shows a larger 15-19 cohort, and this pattern remains consistent across the decades. This unique age distribution, as seen from their respective pyramid shapes, may be partially explained by the location of university dormitories and off-campus student housing, spread across the city and county. Because Albemarle covers a larger geographic area and has a larger total population of 112,395, the percentage share of college students in its total resident population, is lower in comparison to Charlottesville, which has a total population of 46,553, and hence has a much more prominent spike representing its student population.

NOTE: Every decennial census is meant to provide a snapshot of the population characteristics on April 1st at the start of the decade. In spite of the application of Disclosure Avoidance/Differential Privacy2 on Census 2020 data and the issues of age heaping3, the Demographic and Housing Characteristics data (released on May 25th, 2023 by U.S. Census Bureau) is the latest decennial data we have available to understand the current demographic profile of the Commonwealth of Virginia.
Footnotes:
1: Population pyramids are an effective way to graphically illustrate the age-sex distribution of a given population. It uses a paired set of bar-charts to represent the percentage of males and females in each age-group, and provides a clear picture of the age-sex composition of a population.
2: The U.S. Census Bureau have implemented disclosure avoidance methods which add “statistical noise” – small, random additions or subtractions – to the Demographic and Housing Characteristics File (DHC) data, and this affects the population count data for small populations and small geographies.
3: https://www.census.gov/newsroom/blogs/random-samplings/2023/05/age-heaping-2020-census-dhc.html