Which places in Virginia are most attractive?
When people hear that “Northern Virginia drives population growth in the commonwealth,” or “rural communities are losing population,” they immediately think of large numbers of people moving into Northern Virginia or many residents leaving rural counties. Is this true?
In this article, we examine county-to-county (including independent cities) Internal Revenue Service (IRS) migration data, one of the key sources of information used by the Census Bureau to estimate migration each year. We look here at the 2015-2016 data—the most recent information available to the public.
The data are based on change of tax return filing addresses in two consecutive years. If a person filed a tax return in locality A in 2015, then filed a return in locality B in 2016, that person is counted as an out-mover from locality A and as an in-mover to locality B. If a person filed a tax return in locality A in both years, he or she is counted as a non-mover in locality A.
We first calculated for each locality in Virginia the ratios of in-movers, out-movers, and net movers to non-movers, then multiplied these ratios by 1,000. This way we had a standardized measure of the migration flows regardless of each locality’s population size. We then ranked the ratios to identify the top 10 in each category. Figures 1 and 2 below show, for example, that for every 1,000 non-movers in Fredericksburg, there were 210 people who moved in from 2015 to 2016 and 237 people who moved out.
Migration Year 2015-2016


Click here to see net migration rankings for ALL of Virginia’s localities.
A few interesting patterns emerged from the rankings:
- Nine out of ten top in-migration localities are also among the top out-migration localities (except Radford). Population movement is highly dynamic in these areas (mostly cities), as people are constantly moving in and out in relation to job opportunity, housing, and family formation. As a result, net migration gains in these communities are small or mostly negative.
- Northern Virginia experiences large in-flows as well as large out-flows. As shown in Figures 1 and 2, while Alexandria, Arlington, Manassas Park, and Falls Church attract the greatest numbers of people relative to their populations of non-movers, they also, at the same time, lose the most, resulting in net out-migration in Alexandria, Arlington and Falls Church .
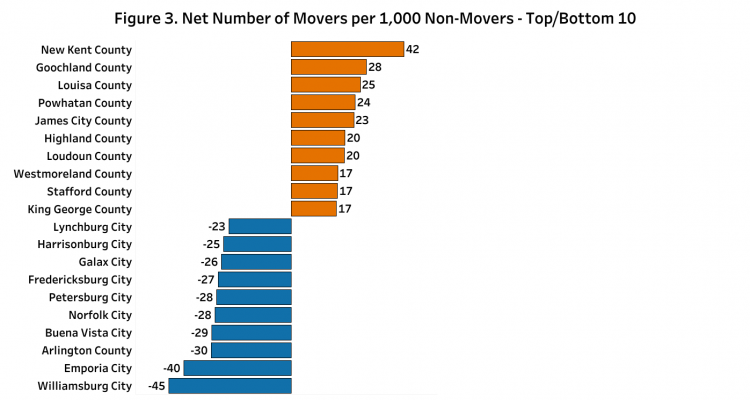
- College towns—like Charlottesville, Fredericksburg, and Williamsburg—also have large volumes of in– and out– flows, mostly due to annual college enrollment and graduation. Some of the college towns are also among the biggest net “losers” in the state, as shown in Figure 3.
- Prince George County and Petersburg, with active duty Army soldiers and military families on and around Fort Lee, also experience frequent in and out movements.
- The most attractive localities in terms of the largest “net” migration gains are mainly suburban counties in or near the state’s major metropolitan areas. New Kent County tops the chart, with a net gain of 42 people for every 1,000 non-moving residents. Others counties include Goochland, Louisa, Powhatan, James City, Loudoun, Stafford, and King George. A couple of rural destinations–Highland and Westmoreland–are also among the top 10 net gainers, mostly attracting retirees or pre-retirees. None of the top net gainers are cities, despite the fact they have recently experienced some of their fastest population growth in decades.
- Cities, rather than rural counties, experience the greatest net migration losses. Among the top 10 largest net losers, all but one—Arlington County—are cities. These cities are, however, a diverse bunch, including college towns like Williamsburg, Fredericksburg, Harrisonburg, and Lynchburg; small, shrinking cities like Emporia, Buena Vista, and Galax; and the two populous localities of Arlington and Norfolk. The last two consistently send more residents to neighboring localities than they receive—Arlington County to Fairfax County, in particular, and Norfolk to Chesapeake and Virginia Beach.
- Contrary to common perception, rural communities are not the biggest losers in terms of out-migration or net migration. Although many counties in Virginia’s Southwest, Southside, and Eastern Shore regions do experience net out-migration, these losses are not the greatest in the state. Most rural counties even have moderate net in-migration. In addition to Highland and Westmoreland counties, Rockbridge, Richmond, Northumberland, and Grayson all have more people moving in than out, to name just a few.
It’s important to point out that domestic net migration is only one component of population growth and decline. Natural increase—births minus deaths—is another key factor that determines population change. The younger population age profile of cities contributes to their growth through births, and the older population age structure of rural communities contributes to their decline through deaths.
Apart from domestic migration and natural increase, international migration–people moving in from other countries as well as moving out of the U.S.–also contributes to population change in localities throughout Virginia.


