Little Green Boxes
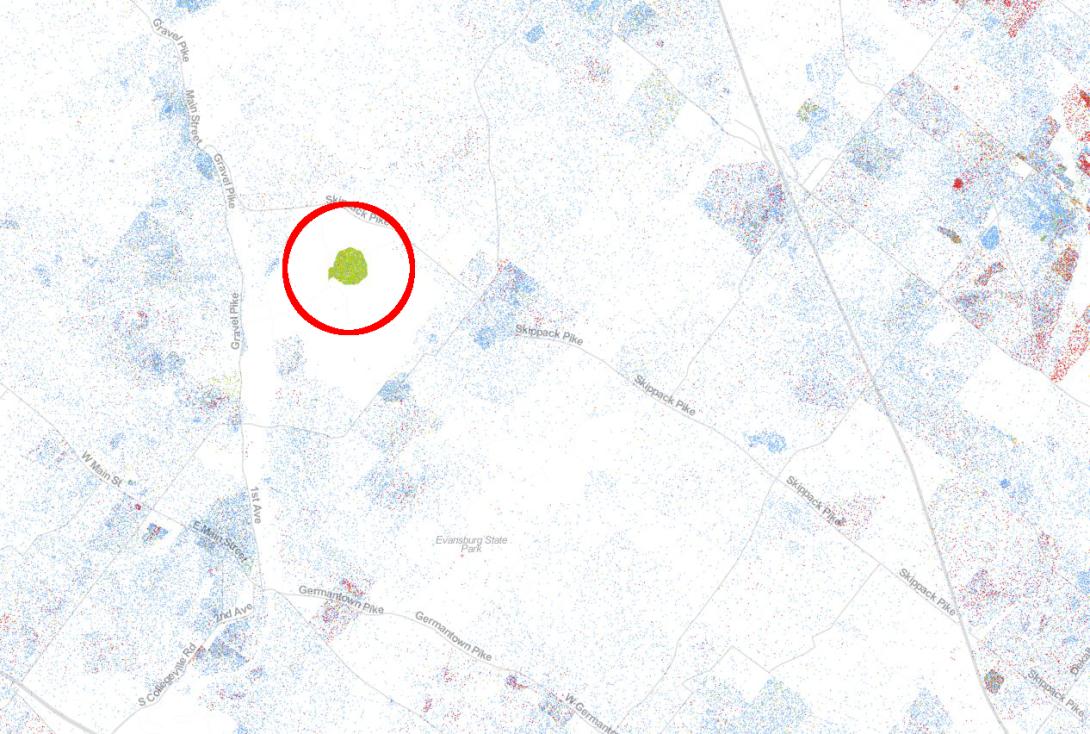
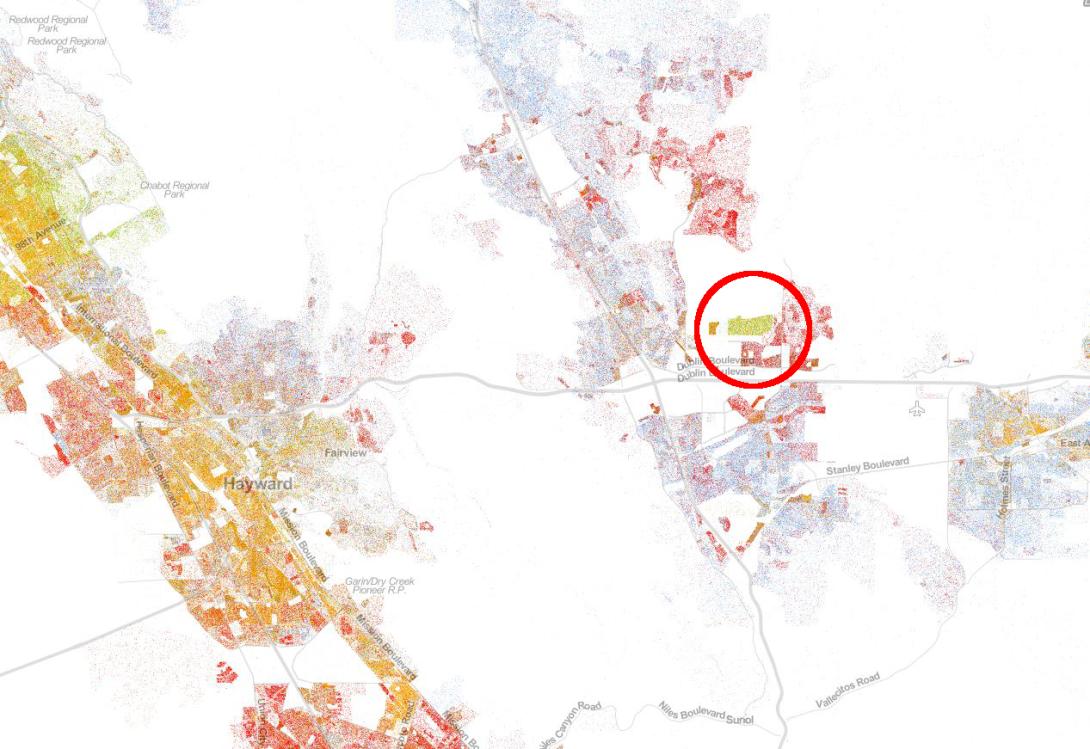
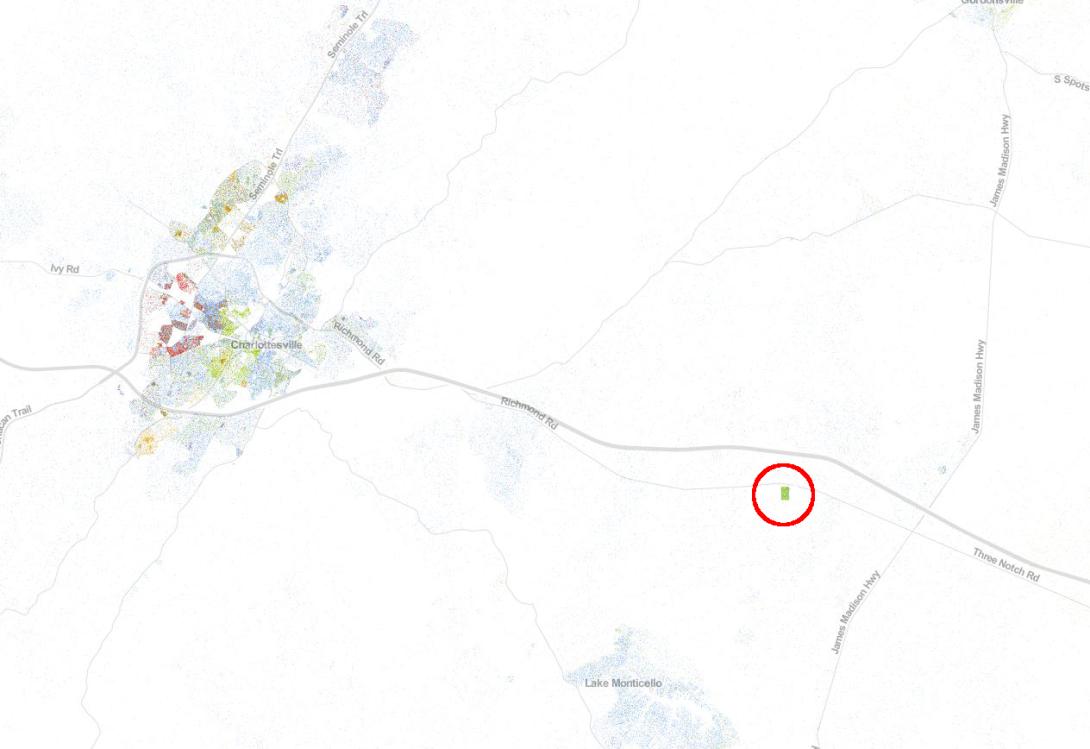
One of the most frequent observations from people who have recently viewed our Racial Dot Map is the presence of these “little green boxes” scattered throughout the country. The map displays a single dot for every person counted during the 2010 Census and every dot on the map is color-coded by race and ethnicity: non-Hispanic whites = blue; African-Americans = green; Asians = red; Hispanics = orange; and all other races = brown. These peculiar green boxes on the map can be found everywhere and seem oddly out of place:
In a suburb of Philadelphia:
Outside of Hayward, CA:
East of Charlottesville, VA:
These oddities are all too easy to find.
Among the mass of demographic statistics that we post on this blog, it is easy to forget one of the most troubling: about 0.7% of the United States resident population, almost 1 in 100 people, is incarcerated in a federal or state prison or local jail, the highest documented rate of incarceration in the world. As it turns out, these folks are also counted during the decennial census.
Just as all of us had to fill out a 10-question census form in 2010, census enumerators travel to jails and prisons throughout the country and either interview inmates or ask the institutions to fill out the necessary information (including age, gender, race…etc.) from their own administrative records. In other words, inmates are counted as living at the correctional facility and not some other residential address. There are many good reasons for this, one of which is that records for inmates’ home addresses (if the inmates have home addresses) simply do not exist at many facilities.
Racial minorities tend to be over-represented in correctional facilities compared with their numbers in the general population. This is particularly true of young black and Hispanic men. For example, Non-Hispanic black males are incarcerated at a rate 6 times that of non-Hispanic white males.
Hence the little green boxes.
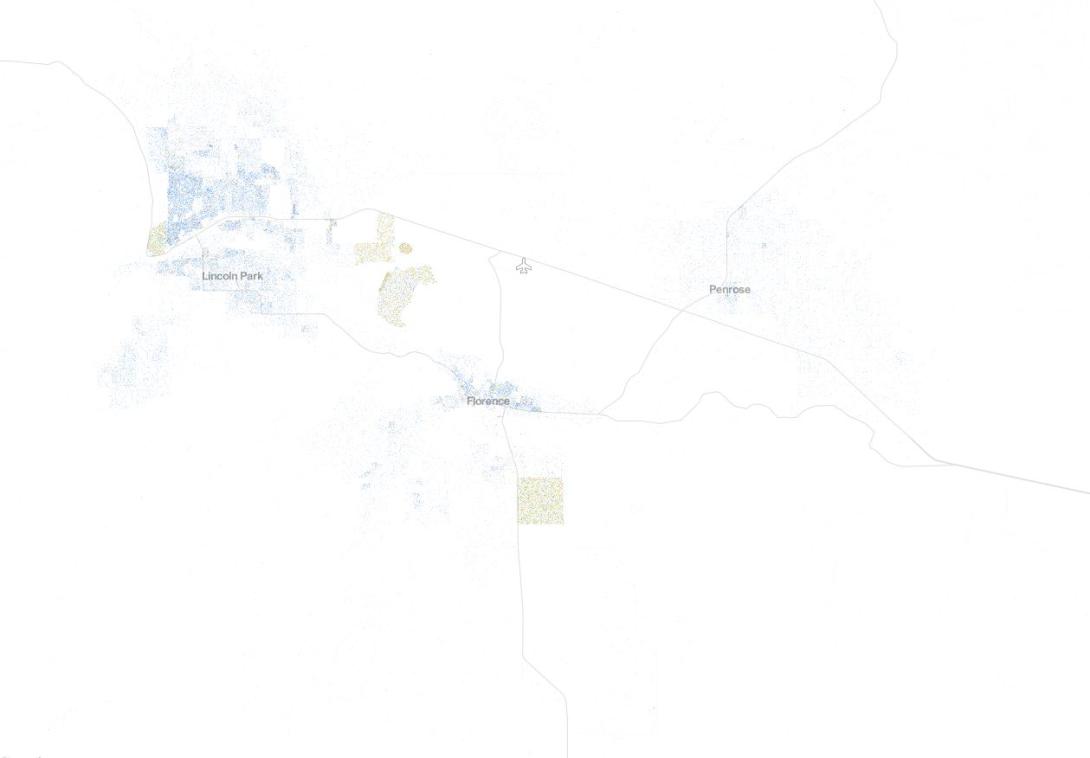
Several more infamous prisons can easily be found on the Racial Dot Map:
ADX Supermax (the “Alcatraz of the Rockies”); Florence, CO:
Rikers Island, New York City:
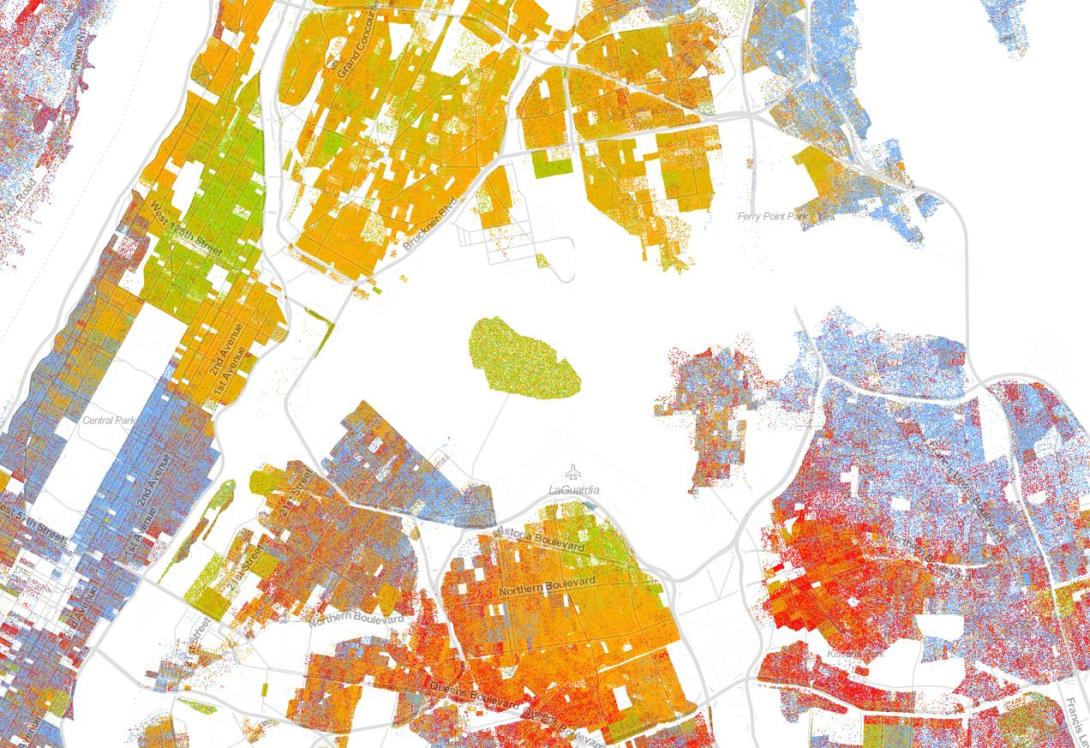
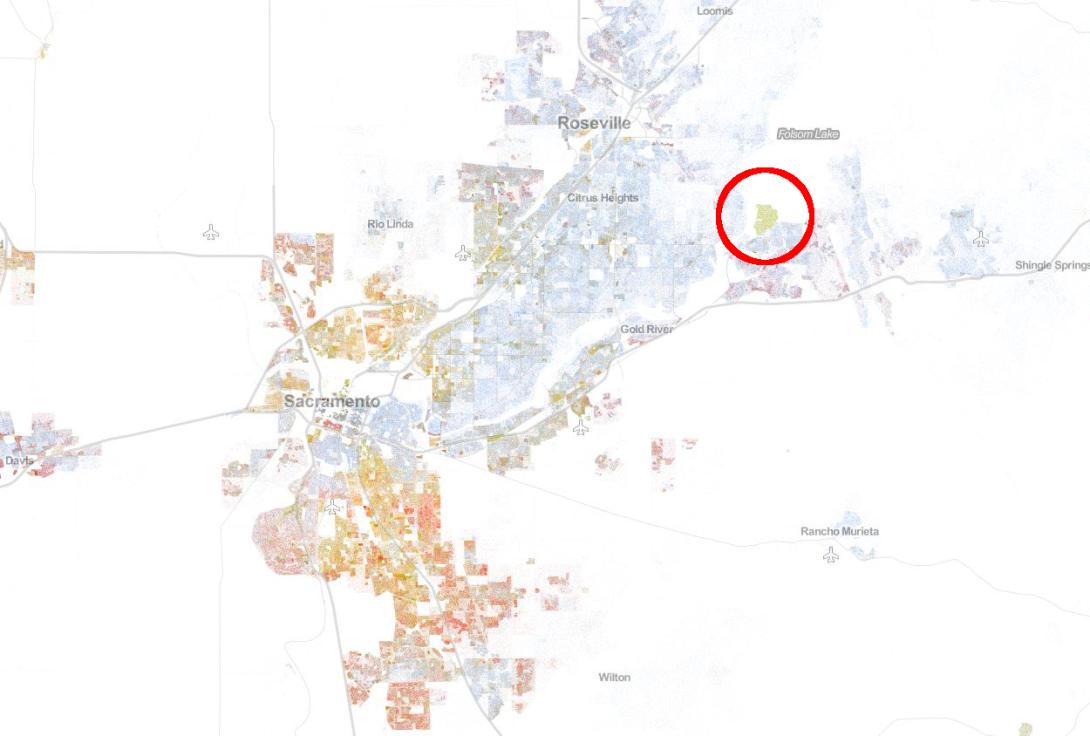
Folsom State Prison; Represa, CA:
If you’re curious, I suggest taking a look at Josh Begley’s Prison Map, a comprehensive Google Earth view of the nation’s correctional facilities.


