An interesting visualization of gay rights in the United States, by state and region
The vote on the proposed Amendment One in North Carolina, which defines marriage in the NC state constitution as between one man and one woman, and bans any other type of domestic legal union, such as civil unions and domestic partnership, passed yesterday. This result has been all over the news today, and it might leave you wondering where your state or other states around the country stand on gay rights issues. The Guardian Interactive has just posted a new interactive infographic depicting gay rights in each of the 50 states and D.C.

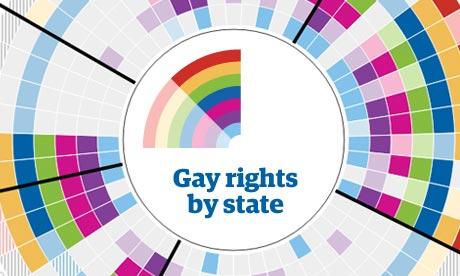
There is a lot going on in this interactive tool. The graphic has seven concentric circles in different colors, each representing a different issue related to gay rights: school bullying, hate crimes protection, housing discrimination, employment discrimination, adoption, hospital visitation, and marriage. Each of the seven circles is segmented to represent a state, and those segments are shaded to show whether state laws provide no rights, limited rights, or maximum rights on each issue.
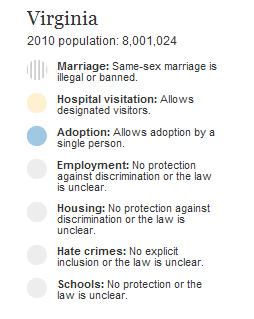
You can move your mouse over the graphic and highlight one state at a time. If you do this, it will make the whole structure more clear. Looking at Virginia as an example, which can be found at about 4 o’clock on the wheel, we see the seven segments shown below.

Moving from the upper left corner outward, the first four Virginia segments are gray, meaning there is no law or the law is unclear concerning gay rights in matters of school bullying, hate crimes, housing discrimination, and employment discrimination. The light blue segment indicates that Virginia has limited gay rights regarding adoption, and the light yellow box means that Virginia has limited gay rights regarding hospital visitation. The outermost segment, which is shaded in gray hatched lines, shows that Virginia has prohibited or banned gay marriage. When we mouse over Virginia and each of the other states, more detail appears on the left-side of the screen, with explanations for each colored segment.

The infographic designers grouped the states into regions, like Northwest and Southeast, which makes it easy for us to identify regional trends. They also have a button allowing us to toggle between “scale states equally” and “scale states by population.” This is a nice additional feature because it allows us, when using the “scale states by population” option, to get a better sense of the proportion of the U.S. population that lives under the state laws prohibiting or providing for gay rights.
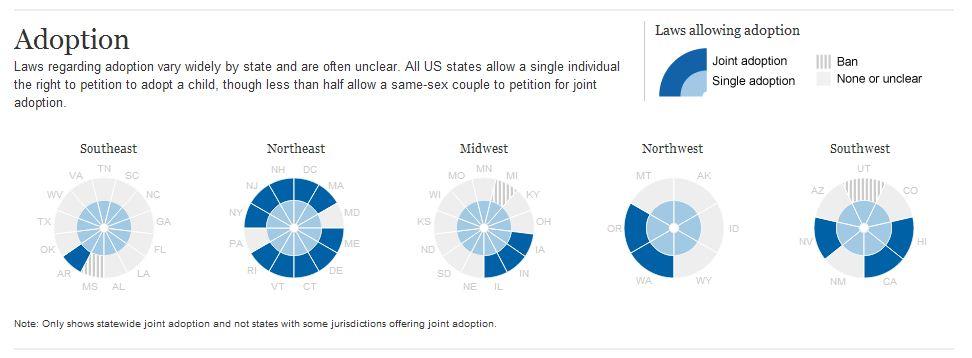
Below the interactive graphic, the authors delve into more detailed regional analysis of each of the seven issues. The image below shows the section on adoption rights.

We saw on the interactive graphic above that Virginia provides limited gay rights when in comes to adoption. This section that specifically examines the adoption issue shows that Virginia law, along with that of all other states, does not discriminate when it comes to single individual’s rights to petition to adopt a child, but that Virginia has no law allowing or prohibiting a same-sex couple to petition for joint adoption.
The authors came up with a very useful interactive tool for displaying lots of information about gay rights in the U.S in a clear way. They provided us with a user-friendly tool that is easy to access layer-by-layer. The tool helps us see where each state stands and how the states relate to each other on these issues.


