Food Stamp Participation by State, 1990-2013
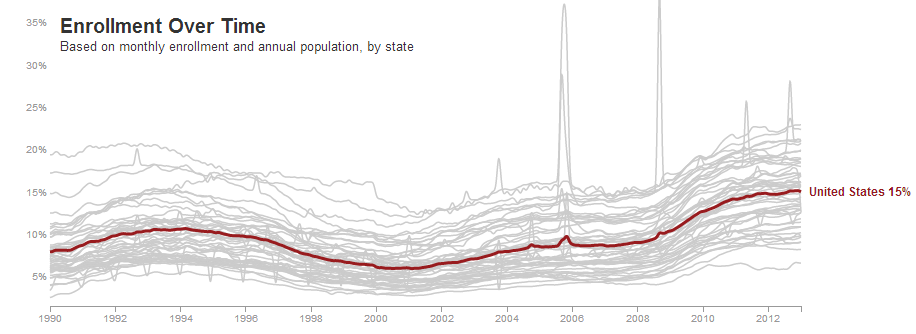
The sluggish economic recovery and changes to participation guidelines have led to a steady increase in the number of individuals relying on food stamps, or the Supplemental Nutrition Assistance Program (SNAP). In January 2013, 47.3 million Americans, or 15% of the total population, received food stamps (Nearly 50 million Americans are living in poverty, according to recent Census Bureau estimates, but individuals and families slightly above the poverty line are eligible for SNAP as well).
The Wall Street Journal recently released a fantastic interactive graphic that shows trends in monthly food stamp participation, by state, from 1990 through 2013. Most states follow the overall national trend: participation rises in the mid-1990s, gradually declines through the boom years of the late 1990s and early 2000s, flattens slightly through the 2000s, and then sharply increases following 2008.

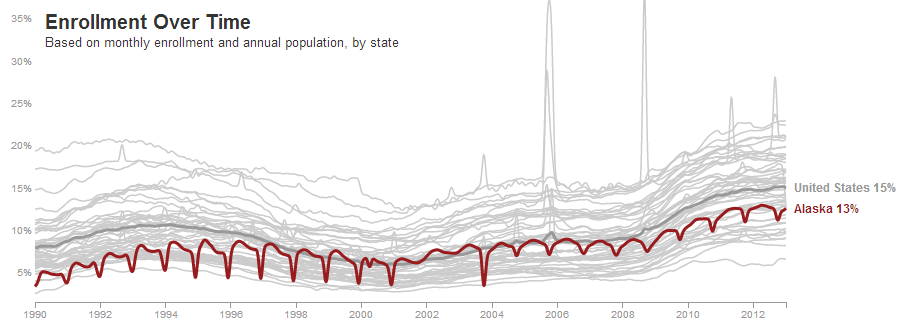
Some states, like Alaska, have strong seasonal fluctuations in participation rates, although the magnitude of this variation has diminished in recent years.

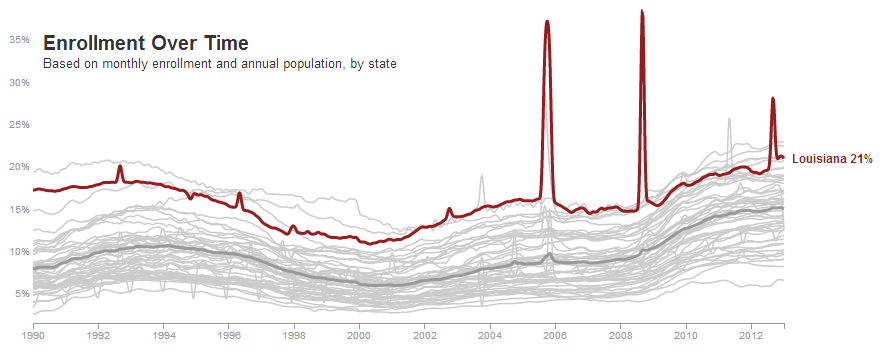
In other states, program participation spikes dramatically following natural disasters. In Louisiana, SNAP enrollment nearly doubled in late 2005 following Hurricane Katrina. Damaging hurricanes in 2008 (Gustav and Ike) and 2012 (Isaac) led to similar spikes in enrollment.

Interested in exploring more? The USDA provides an interactive map of SNAP participation, benefit amounts, and socioeconomic indicators by county for 2006-2010.


