


Density: three Virginias

Here is a fun map showing the distribution of people across Virginia by the density of their census tract. Each color represents one third of the total population. For the purposes of this post, I’ll refer to them as the “densest third,” the “middle third,” and the “sparsest third.” I’m tempted to call them the “urban third,” the “suburban third,” and the “rural third,” but the cutoffs are arbitrary and those names aren’t entirely accurate. It’s probably more accurate to talk about 25% of the population living in “urban” neighborhoods and 25% living in rural areas, with a “suburban half” in between.
The “densest third” live on approximately 1.2% of the state’s land area. The “middle third” occupy about 4% and the “sparsest third” occupy the remaining 94.8%. It’s obvious from the map how Virginia’s explosive population growth over the past few decades has been concentrated in its three major metro areas: Northern Virginia, Richmond, and Hampton Roads.
What do these densities look like?
Population density can be expressed in a number (persons per square mile), but it may not be obvious what those numbers look like. Here are a few pictures to help you better visualize how the these three groups live.
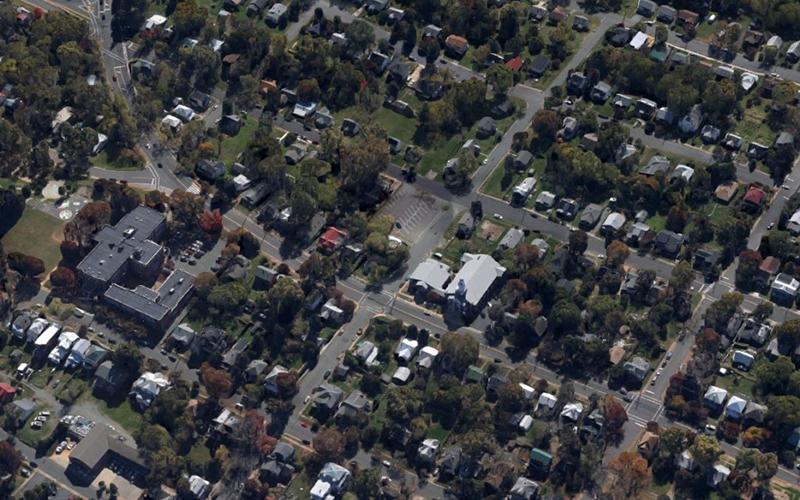
1. The “densest third” live at a density of 3,560 or more. It may not always seem like it, but Virginia is big and lacks much in the way of real cities. Despite taking up only 1.2% of the state’s land area, the densest third of the population mostly don’t live in neighborhoods that would pass as “urban” elsewhere. The lower bound of 3,560 is still very comfortably suburban. While there are a few places with high-rise apartment buildings or tightly-packed rowhomes, the total population density across the urban third is only 5,700 people/square mile. That’s about what you’d find in a place like Annandale, Roanoke, or South Norfolk.
The Belmont neighborhood in Charlottesville is a perfect picture of what 5,700 people per square mile looks like. While still made up largely of single-family homes with some apartments and stores thrown in, the homes occupy smaller lots and are arranged efficiently via a street grid. The grid makes the area convenient for walking by minimizing travel distance rather than driving time. While most trips in a neighborhood like this will still involve a car, the distances traveled by the cars are shorter. Parking is shared and more dispersed, further conserving space:
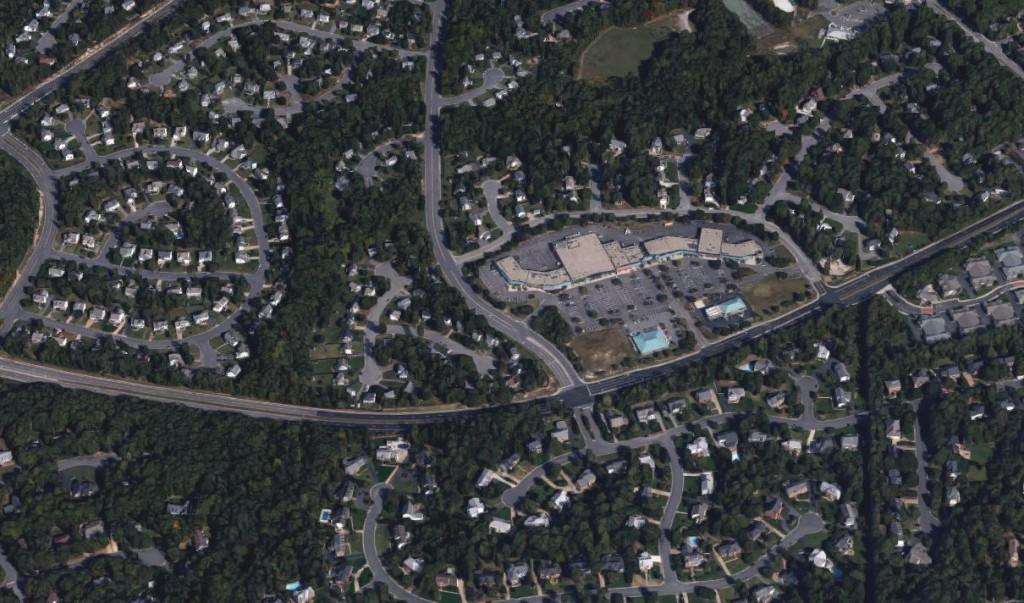
2. The “middle third” lives in smaller towns or suburbs surrounding major metros. The total population density across these tracts is about 1,700 people/square mile. That’s going to look something like this neighborhood west of Richmond, with single-family homes on larger lots. Notice the large gaps between developments, created by the winding road and cul-de-sac pattern of suburban development. Since roads and other infrastructure are built by developers on large tracts of cheap land, they are configured to maximize the value of each individual house, ensuring that none of them are located on a major thru street. This road configuration and the distances it creates means more vehicle miles traveled, leading to more road space per person. All destinations are also surrounded by ample off-street parking lots, which require twice as much area as the same number of parallel parking spaces:
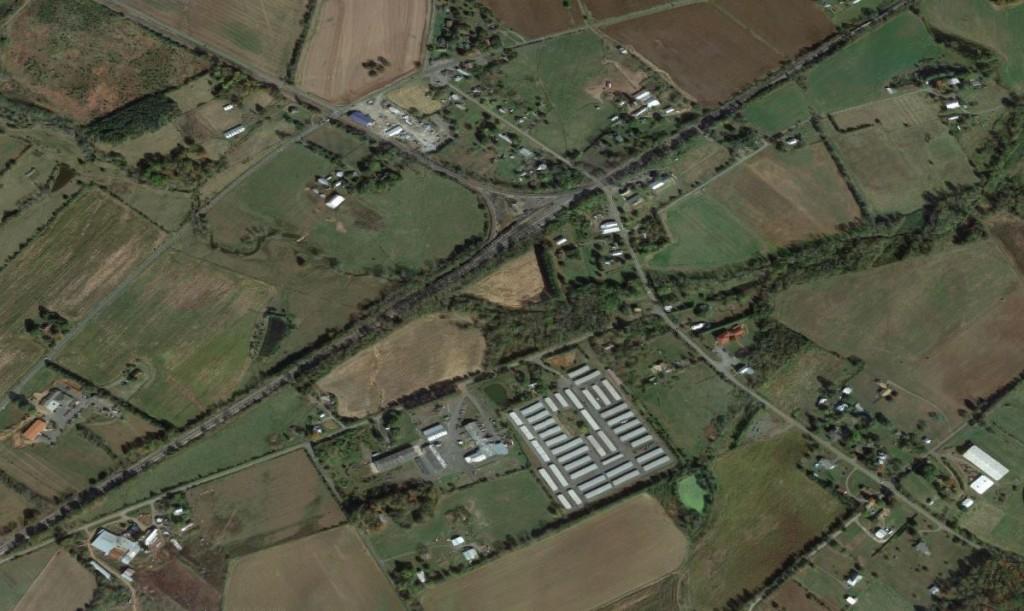
3. The “sparsest third” of the population occupies the least populated tracts. The upper limit for this group (735 persons/square mile) is still fairly suburban and suggests some kind of town or metro area nearby. Only about 1/4th of the population of the state lives in census tracts that can truly be termed “rural.” But the overall population density for this group is about 75 persons/square mile. That’s the sort of density you’ll find in a well-populated countryside, with scattered rural subdivisions and no major wilderness areas. It looks something like this part of Fauquier County:
Comparing these three groups
The differences between these groups are interesting. Density correlates with a few different demographic variables, though the reasons are rarely simple or one-dimensional. One of the strongest correlations is with race and ethnicity:

As in most of the United States, Virginia’s rural areas are predominately white. There is also a large rural African-American population, a distinguishing mark of the lowland Southern states. Other racial and ethnic groups, especially Asians and Hispanics, are more likely to live in denser cities. These groups have immigrated more recently and immigrants, like young people, almost always start out in cities. Cities provide opportunities for economic advancement that don’t require lots of capital, family connections, or inherited land.
Income and Poverty
Income doesn’t vary immensely, but as one might expect, rural areas tend to have lower incomes and a slightly higher proportion of the population in poverty. The middle density areas are likely to have the least poverty. This is almost certainly a change from two decades ago, when densely populated central cities would have been likely to be much poorer.


Age
Also to be expected is the breakdown by age. Children are least likely to be found in the most rural areas and are somewhat more likely to be found in the middle density tracts. Young adults are most likely to be found in high density tracts, while older age groups form a steadily larger proportion of the population as one moves out to rural areas. This is consistent with other research showing that young adults tend to start out in cities while retirees move out into the countryside.

Rent
And perhaps least surprisingly of all is the variation in median rent. This is a quick and dirty unweighted calculation, so it is actually a median of medians, but I ran a few checks to ensure that a more precise calculation would be similar.

Population density implies that land is scarce, therefore we would expect it to cost more. Now additional units could be built fairly easily in most of the places where the densest third live, but zoning codes in the U.S. limit the ability of property owners to construct more units without significant political will. Therefore, living space is made scarce as well and rents get higher as density increases.
There are plenty of ways to split up and analyze the state’s population, but density should be one of the most important. Understanding why population is distributed the way it is can give local leaders a better sense of how to improve their citizens’ lives.