As the U.S. population grows increasingly diverse, Census race categories are struggling to keep up
In 1998, President Bill Clinton startled an audience of students by making this statement:
“In a little more than 50 years there will be no majority race in the United States. No other nation in history has gone through demographic change of this magnitude in so short a time.”
While few people in 1998 were aware of the Census Bureau projection cited by the president, the growing diversity of the U.S. population has received substantial attention since then. Census projections released and widely covered by the media since the 1998 Clinton speech also predict whites will become a minority during the 2040s. Public and private sector leaders have reacted by increasingly focusing on diversity within their organizations.
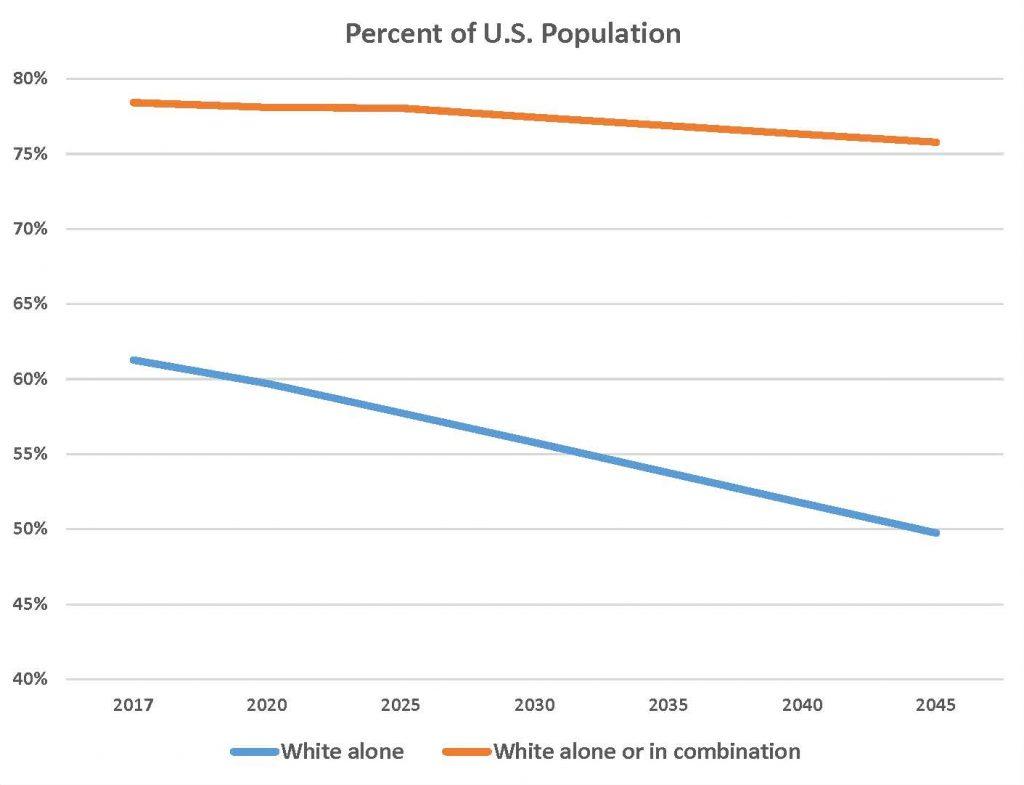
Yet, what is less commonly known is that the same Census projections that predict Americans who identify as white alone will become a minority during the 2040s also predict that about 75 percent of the U.S. population is expected to mark the box next to White on their Census form, either alone or in combination with another race or ethnicity. That percentage is fairly close to the share of the U.S. population currently identifying as white, and is about the same share as in the first census in 1790. The fact that the same Census projection can show whites becoming a minority by 2040 and also show the percent of Americans who identify as white remaining close to levels counted in previous censuses is an indicator of how the race categories we use are struggling to keep up with our changing population.
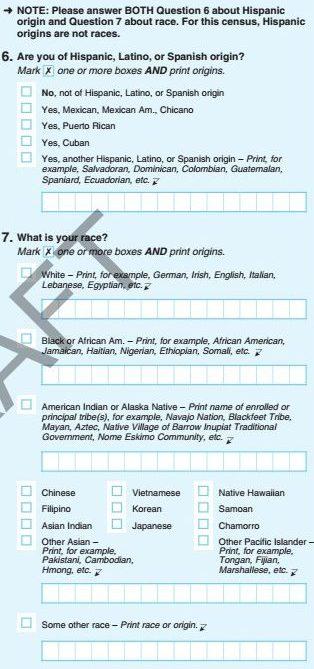
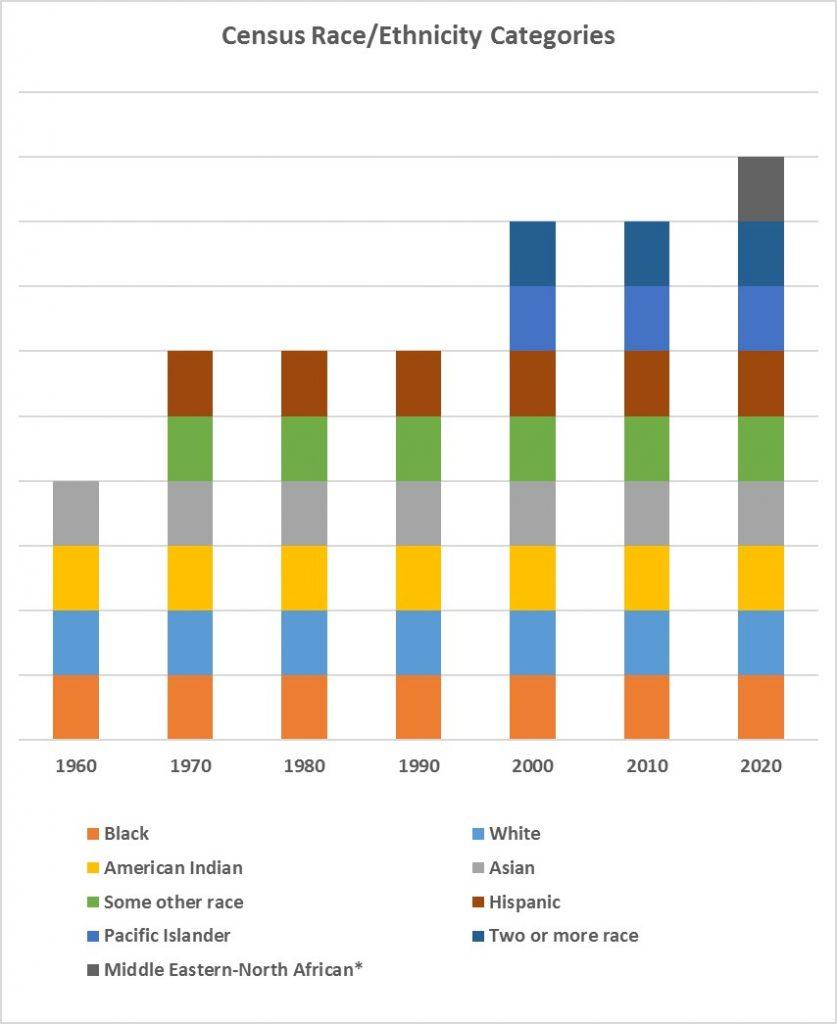
Race is self-reported on the census, and the Census Bureau began allowing survey respondents to mark both the race and the Hispanic boxes in 1980. Beginning in the 2000 Census, survey respondents were allowed to mark multiple race boxes in addition to the Hispanic box. Since 1980, the share of respondents identifying as more than one race or ethnicity has steadily risen, from 6.5 percent of the population in 1980 to a projected 31 percent of the population in 2050. The gradual addition of more Census race categories over the last few decades has also allowed a greater number of people to identify as multi-racial.
The way Americans think about race is changing quickly. A Census Bureau study found that parents from two different races were considerably more likely to identify their children as multi-racial in the 2010 Census than in the 2000 Census. Similarly, in the 2017 Census American Community Survey, U.S.-born adults between the ages of 25 and 45 were 14 percent more likely to identify as being multi-racial than in 2012, when that same group was five years younger.
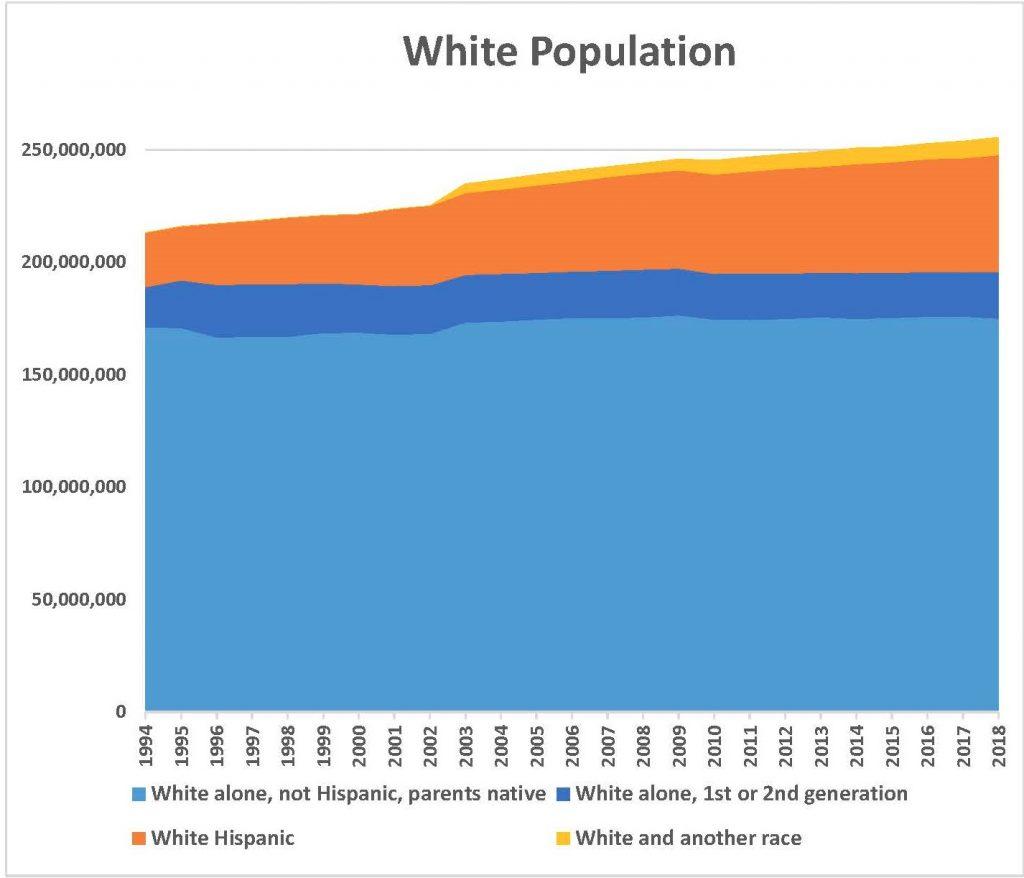
This trend of increasingly marking more than one race/ethnicity box on the census can be clearly seen among white Americans. The number of Americans who identified as white and Hispanic rose by 67 percent since 2000, and the number identifying as white and another race nearly doubled. During that same time, the population identifying as white alone grew by a minimal four percent. The rapid growth of the white and Hispanic, and white and another race groups, along with the slow growth of the white alone group is why Census projections predict Americans who identify as only white will be a minority by the 2040s.
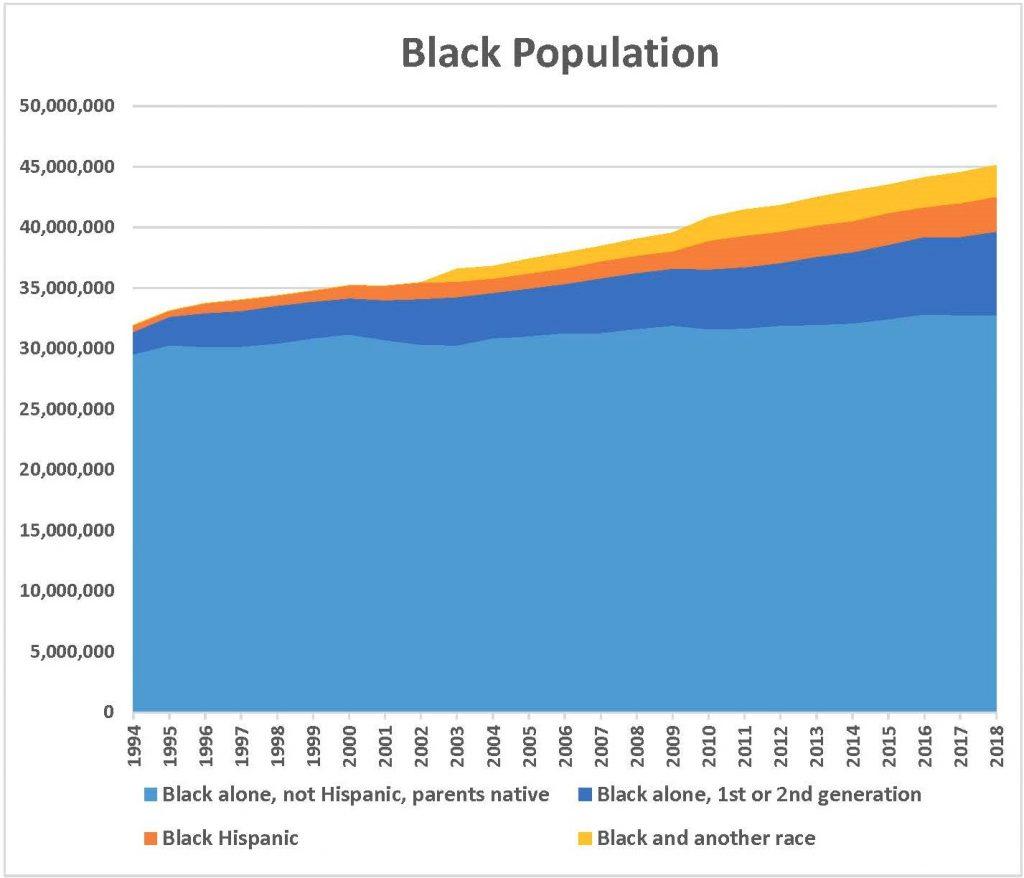
A broader examination of U.S. racial groups shows that the increasing diversity within the white American population is not a unique trend. Since 2000, 85 percent of the growth in the black American population has come from black Hispanics, immigrants from Africa and the Caribbean, and a growing number of those who identify as black in combination with another race. Between 1995 and 2018, the share of black Americans who also identified as being Hispanic, multi-racial, or as an immigrant or a child of immigrants tripled from 10 to 30 percent. If trends since 1995 continue, by the 2040s, only a minority of blacks will identify as black alone and have ancestry in the U.S. that predates the Civil Rights Era.
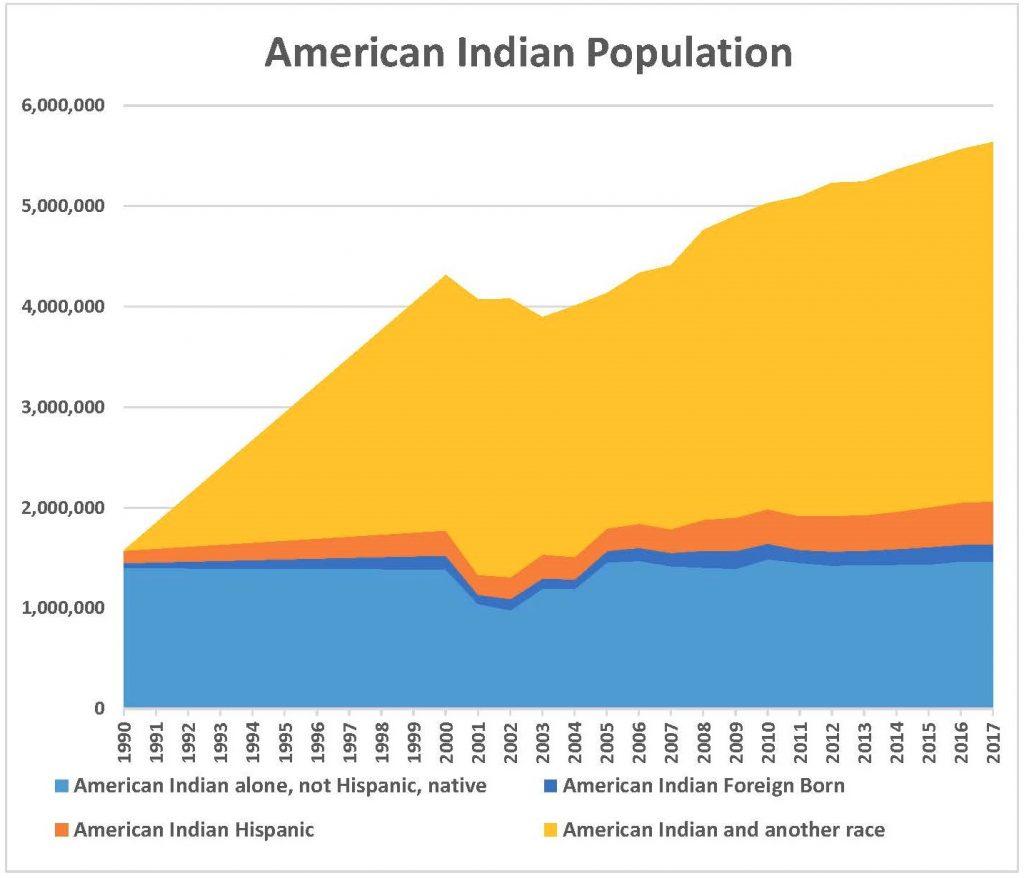
Over the last few decades, the composition of the American Indian population has undergone an even more dramatic change than the black and white populations. Since 1990, the number of those identifying as American Indian has nearly tripled, with almost none of the growth coming from immigration. Census Bureau researchers have found that much of the reported growth in the American Indian population has been driven by people changing their race response to include American Indian. In 2017, 62 percent of American Indians identified as multi-racial or Hispanic, while nearly a quarter of people who identified as American Indian were not able to specify their tribe, compared to 11 percent in 1990.
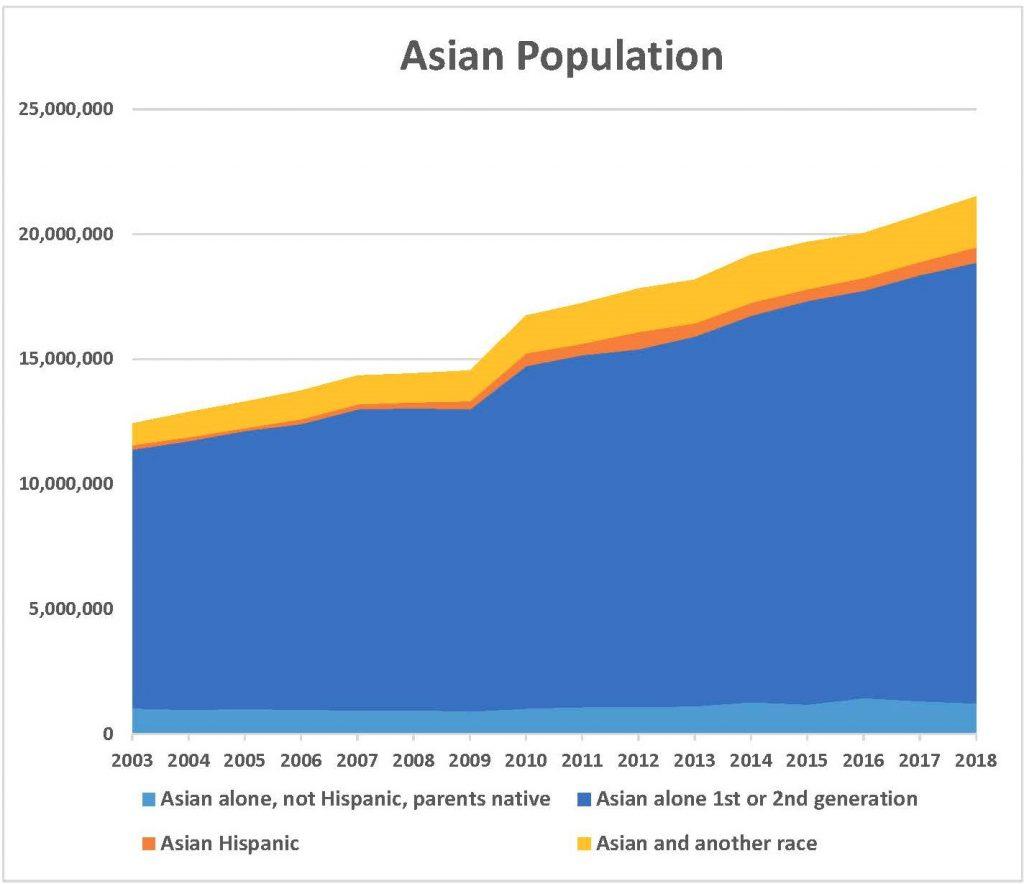
The proportion of Asian Americans who are immigrants or the children of immigrants has remained around 90 percent in recent decades, but Asian Americans born in the U.S. have a high intermarriage rate with other racial/ethnic groups. Among Asian Americans who are not immigrants or the children of immigrants, the number identifying as only Asian has barely increased over the past fifteen years, while the number of those who identify as being Asian in combination with another race has doubled, and the Asian-Hispanic population has tripled. Nearly half of all Asian Americans who are not immigrants or the children of immigrants identify as multi-racial or Hispanic, up from 26 percent in 2003. Over the next few decades, the percent of Asians identifying as multi-racial or Hispanic will likely grow substantially if intermarriage rates remain at current levels.
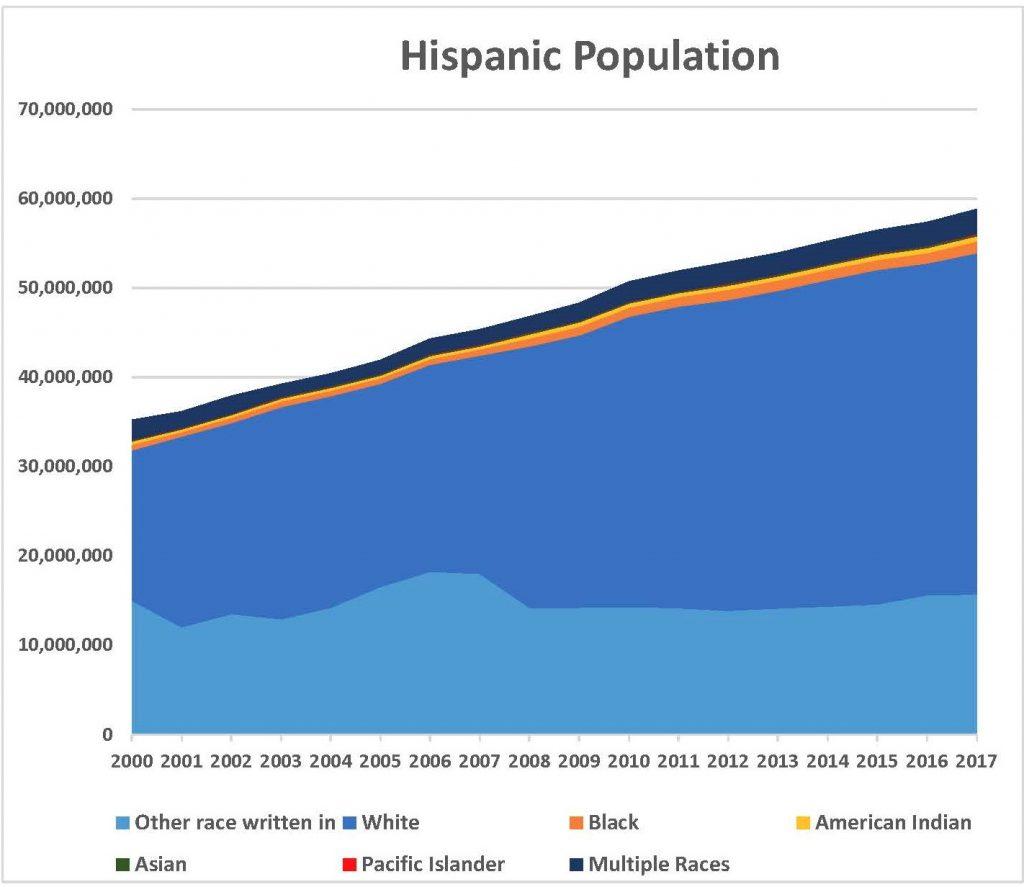
The Census Bureau considers Hispanic an ethnicity, meaning that Hispanics are required to also select a race on the census. In the 2000 Census, a large portion of Hispanics wrote in “Hispanic”, “Latin American” or their country of origin instead of selecting one of the Census Bureau’s race categories. But the Census Bureau found that between the 2000 and 2010 Censuses, millions of Hispanics changed their race response from a written-in response to one of the Census Bureau’s race categories. More recent data from the Census American Community Survey indicates the trend has continued this decade. As a result, since 2000, the number of Hispanics writing in their own race has only grown by 4 percent. During this same time, the number of Hispanics identifying themselves also as either Asian, Black or White has doubled. In the 2000 Census, fewer than half of Hispanics identified as white alone, but in the most recent Census data, nearly two-thirds of Hispanics identified as white alone.
Though the Census Bureau attempts to publish race/ethnicity data in a consistent format from census to census, these significant changes in the composition of America’s population should raise questions about the comparability of race data over time, as well as the proper use of the data. Consider these two examples: in 1990, the poverty rate for American Indians was 33 percent, considerably higher than the national poverty rate of 13 percent. By 2017, the American Indian poverty rate had fallen to 24 percent after millions of Americans began identifying as American Indian, even while the national poverty rate had risen. As the U.S. black immigrant population has grown, black immigrants are overrepresented in our nation’s university enrollments, which statistically obscures the underrepresentation of native born black Americans in universities. At Harvard University, the director of the Center for African and African American Research estimated that over half of Harvard’s black undergraduates were immigrants, the children of immigrants or multiracial. The changing definitions of race, both technically, and individually-selected race categories on the Census, make comparative research on racial groups complex.

The decades since the projections cited by President Clinton have proven his point to be accurate: America’s population has grown considerably more diverse. But what the projections didn’t forecast is that the populations of each race would also become significantly more diverse by becoming more multi-racial and multi-ethnic. Given the substantial changes in the composition of each racial group over the last few decades, by the time the population that identifies as white alone becomes a minority, it is difficult to project what any of our racial categories will actually mean.


