Will Whites be a minority by 2040?
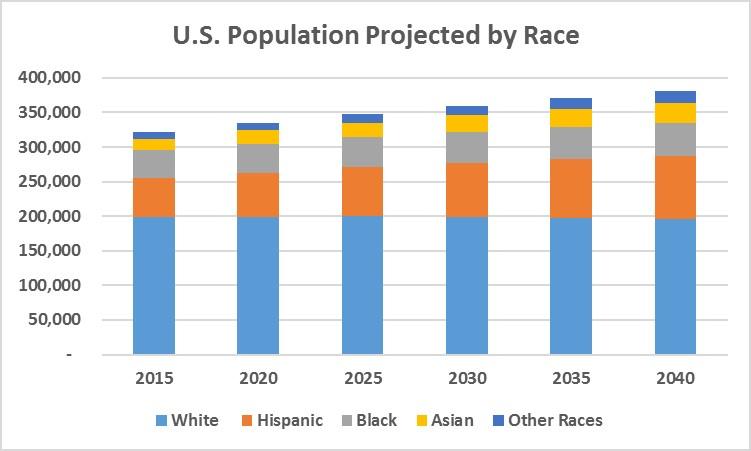
Last month our office released Virginia’s population projections for 2020 until 2040. If you combed through the data tables, then you may have noticed one striking prediction—Whites will make up less than half of Virginia’s population by 2040. Recently, the Census Bureau made a similar projection for the nation as a whole. While these types of predictions about how the U.S. population will change have received a good deal of attention in recent years, there has been little examination of how the U.S. non-White population could manage to grow from 12 percent of the population in 1960 to over 50 percent by the 2040s. The addition of new census race/ethnicity categories in recent decades, such as Hispanic and Two or more races, has played an underappreciated role in the growth of the U.S. minority population.

Both our projections and the Census Bureau’s expect Whites to become a minority not because the U.S. White population will shrink considerably but because the U.S. non-White population is expected to grow much faster. Though all non-White racial/ethnic groups are predicted to grow in size, Hispanic Americans are expected to contribute to the bulk of population growth between now and 2040, making up 59 percent of all population growth nationally and 77 percent of all growth in Virginia. But any projections for over 2 decades out that rely on one group maintaining such rapid growth should be treated with some caution.
The U.S. Hispanic population grew at a tremendous rate during the 1990s and part of the 2000s, fueled by high immigration and birth rates. The population projections count on these past trends continuing into the future. But since 2007, migration to the U.S. from Latin America has slowed considerably. For several years during the recession more people were leaving the U.S. for Mexico than moving from Mexico to the U.S. During the same period, the birthrate for Hispanics in the U.S. declined rapidly. As a result, annual growth among Hispanics in the U.S. fell from 4.4 percent between 2000 and 2007 to 2.7 percent since 2007.

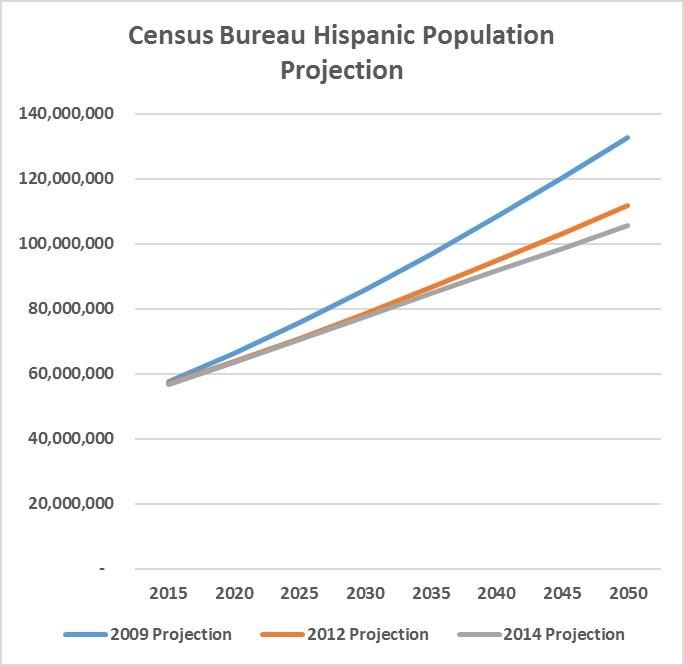
Population projections are beginning to incorporate this shift in trends. Since 2009, the Census Bureau has lowered its projected growth in the U.S. Hispanic population by over a third. Unless migration from Latin America and the Hispanic birth rate in the U.S. bounce back, the next projection for the U.S. Hispanic population in 2050 will likely be even lower.
The creation of White minorities
As the chart above shows it can be easy to read too much into very long term population projections. They have high margins of error and are likely to continue to change significantly each time they are updated. But all of the racial/ethnic projections only make sense if you understand the haphazard way we categorize and track race in the U.S. . For example, the large majority of Hispanic Americans identify as White when surveyed, but the Census Bureau and other data disseminators typically categorize them as a non-White minority because they also identify as Hispanic.
Prior to 1970, Hispanic Americans were also categorized as White by the Census Bureau along with most Americans with ancestry in Latin Countries. But after the Civil Rights Acts of the 1960s, the National Council of La Raza successfully lobbied to have anyone with a “Spanish origin” counted as a separate ethnic population in the 1970. Armed with data for the newly categorized Hispanic population which the 1970 census supplied, organizations could apply for various grants and develop policies specifically for Hispanic Americans. Other groups, after seeing the success of La Raza, have lobbied to have various U.S. ethnic populations counted separately. As a result, the number of race/ethnic categories on the census has risen from four in 1960 to possibly nine by 2020.

The addition of these new racial categories has made it difficult to compare changes in U.S. racial/ethnic groups over time and can exaggerate the growth in racial diversity within the U.S. For example, most growth in the U.S. minority population since 1960 has been fueled by Hispanics who also still largely identify as being White. Similarly, since the Census began allowing respondents to identify as more than one race in 2000, the U.S. mixed race population has grown from zero to nearly 10 million, with 86 percent selecting White as one of their races. Among U.S. residents with a Middle-Eastern or North African origin, which the Census has proposed counting as a separate race in 2020, 91 percent identified as White in 2015.
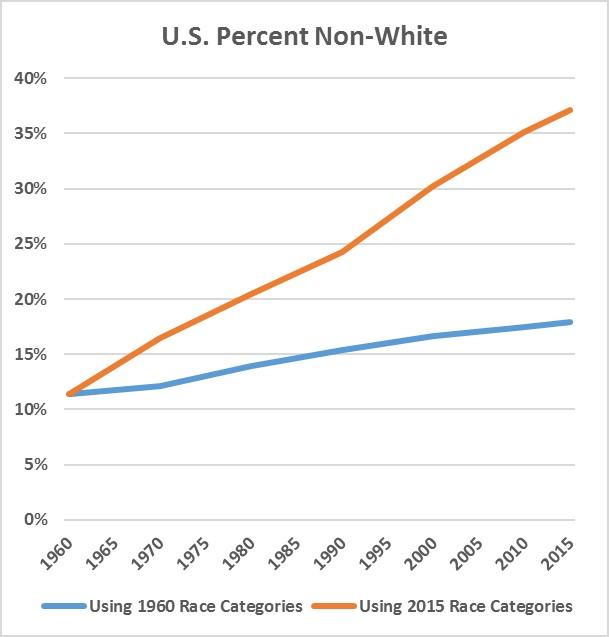
Not accounting for the addition of new race categories makes it appear that minority population has grown much faster than it actually has. Most analysis of growth in the U.S. non-White population since 1960 is inconsistent due to the fact that one must use the 1960 race categories (of which there were only four) for 1960, while eight race categories are typically used today. This type of analysis shows that the non-White population jumped from 12 percent to 37 percent of the U.S. population during the period. However, using the four 1960 race categories consistently across the entire time series shows that the non-White population actually grew much more slowly. —from 12 to 18 percent between 1960 and 2015. If the 1960 race categories were still used, most of the U.S. minority population today would likely be categorized as White alone.

Analyzing changes in the U.S. population is more difficult when you consider the tenuous connection many Americans have to racial categorization systems. When the Pew Research Center compared the responses of the same group of people in the 2000 and 2010 census, it found that millions had changed which racial/ethnic groups they identified with from one census to the other. A similar Pew study showed that within a surveyed population between 4 and 17 percent identified as multi-racial, depending on which questionnaire they used.
If the Census Bureau’s proposal to count Middle Eastern and North African Americans as a separate race is approved, it will further increase the size of the U.S. non-White population, possibly making it larger than 50 percent of the total population before 2040. On paper the change in categories means further diversification in the U.S. population, in the same way that adding other race categories in recent decades has. But the increases in diversity generated by shuffling populations from one race category to another should be raising more questions about how we define diversity and ideally a more thorough examination of demographic data before it is used.


