Virginia’s Changing Population Growth Trends
The Census population estimates for 2011, released early in April, received a good deal of attention in the media, in large part because the estimates showed a noticeable change in population growth patterns from those of the last decade. Growth from April 2010 to July 2011 was concentrated in urban areas in contrast to the previous pattern when, at the height of the housing market in 2006, the highest rates of growth were in the outer-suburban counties. USA Today produced an excellent map showing the change in growth patterns by comparing the growth rate in 2006 with that of 2011.
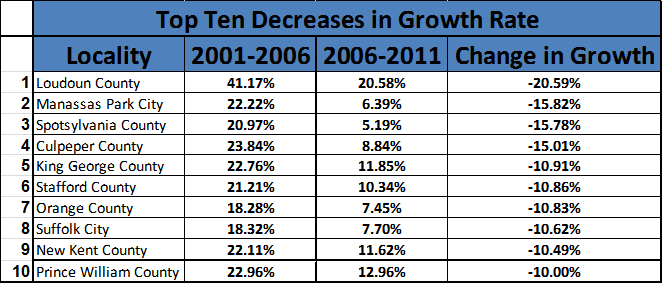
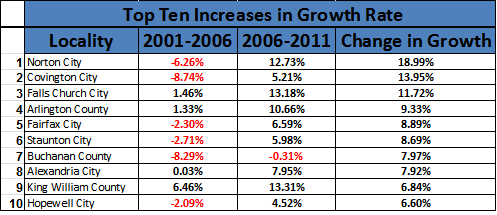
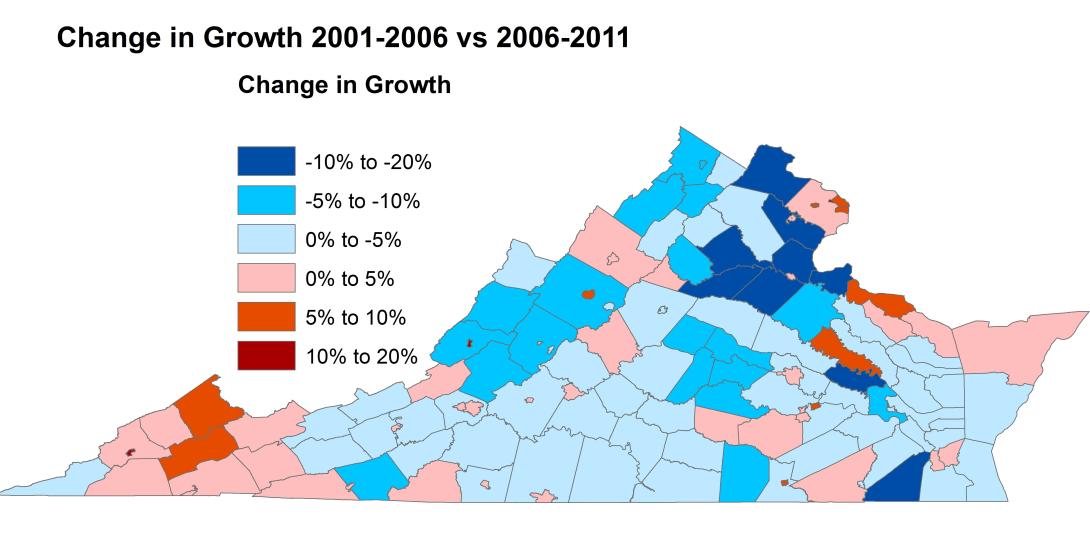
A number of commentators noted that these recent census numbers are only estimates, and that the estimates provide a snapshot of just one year, making it hard to observe a trend from the data. To make it easier to spot trends, we can examine both the annual population estimates from 2001 to 2011 and the 2010 census count. For example, comparing the total population growth from 2006 to 2011 with the population growth from 2001 to 2006, as shown in the table below, can help us focus on where the growth patterns changed the most.

What is most noticeable in the table above is that the localities which experienced the most significant declines in their growth rates are in the outer-suburbs of their metro areas, which is in keeping with nationally observed trends. Most of the outer-suburban counties experienced rapid growth during the housing boom from 2001 to 2006. Many of these same areas experienced a significant drop in the rate of growth over the next five years, however some, such as Loudoun, still grew faster than Virginia’s population growth rate of 5.3% between 2006 to 2011.

As seen in the table above, many of the localities which experienced the largest acceleration in their growth rates were localities which had lost population between 2001-2006, particularly Virginia’s independent cities. Additionally, urban localities such as Arlington County and Alexandria City experienced a significant acceleration in their growth rates, matching national trends.
Why would this pattern of large increases in growth rates in independent cities and significant decreases in suburban counties occur?
Population change is caused by three factors: migration, births, and deaths. Before 2006, the rapid population growth of outer-suburban counties such as Loudoun or King George was driven by migration-many more people moved into the counties than moved out.

As the housing market slowed, fewer people could sell their homes or find jobs. Many people were unable to move, helping smooth out growth rates throughout Virginia. Previously fast-growing outer-suburban localities’ growth rates slowed as fewer people moved in, while slower-growing or declining urban localities saw an uptick in their growth rates because fewer people moved out.
Small independent cities are something of an oddity among these trends. Though they are called cities and have completely separate governments from their surrounding counties, many of Virginia’s independent cities are hardly urban. For example, Norton has 4,000 residents. But two thirds of all independent cities experienced an acceleration in their growth rates, matching national trends for urban areas.
Fewer people moved from independent cities when the housing market cooled. Many independent cities such as Staunton and Norton also experienced sustained in-migration, meaning more people moved in than moved out, which boosted their populations. Additionally, the populations experienced natural increase, which occurs when there are more births than deaths, or by a slowing in natural decrease, which occurs when there are more deaths than births. With a slow housing market many city residents may have been unable to move into neighboring suburban counties to start families. The resulting higher birth rates in cities have caused those areas to lose significantly less population to natural decrease or to even gain population through natural increase. In 2008, Staunton had more births than deaths for the first time since 1991.
Housing permit data matches these trends; between 2000 and 2005, there were nearly seven times as many housing permits issued in counties neighboring independent cities than in the cities. Between 2006 and 2010 this figure shrunk to less than four times as many, as the number of housing permits issued declined more rapidly in neighboring counties than independent cities. In comparison to their more rural neighboring counties, small independent cities may offer similar attractions as those found in larger urban areas such as more municipal services, proximity to work opportunities, and more housing and transportation options.
Comparing population growth rates from 2001-2006 and 2006-2011 shows that the trends suggested by recent population estimates are more than a statistical fluke. The recession significantly altered the growth patterns in Virginia, smoothing out growth rates across much of the state, and accelerating urban population growth in the last five years.


