What are the young people up to these days?
Much has been made of the living preferences and economic situation of millenials. In the current economy, most localities can expect to lose almost all of their brightest young people to college towns. Whether these localities are able to lure these college graduates back is another story, and an important one since (many argue) it’s during the free-and-easy years after college that most young people will start businesses, launch careers, and develop regional networks and allegiances.
In this post, I’ll take a closer look at the people who were in their 20’s during the 2010 census. That’s people born between 1980 and 1990. As one might expect, those 80’s babies were reasonably well-distributed when the prior census was taken in 2000. At this point, the millennials were anywhere from 10 to 19 years old. There was an uptick in college towns (18 and 19 year-olds), but it wasn’t huge. In fact, that uptick helps to balance out the number of millenials who were undergraduates during the 2010 census (20 and 21 year-olds).
Ten years later, some of those kids are still in college or graduate school, some are young professionals, some are in the military, some are in prison, and some have young families with several kids.
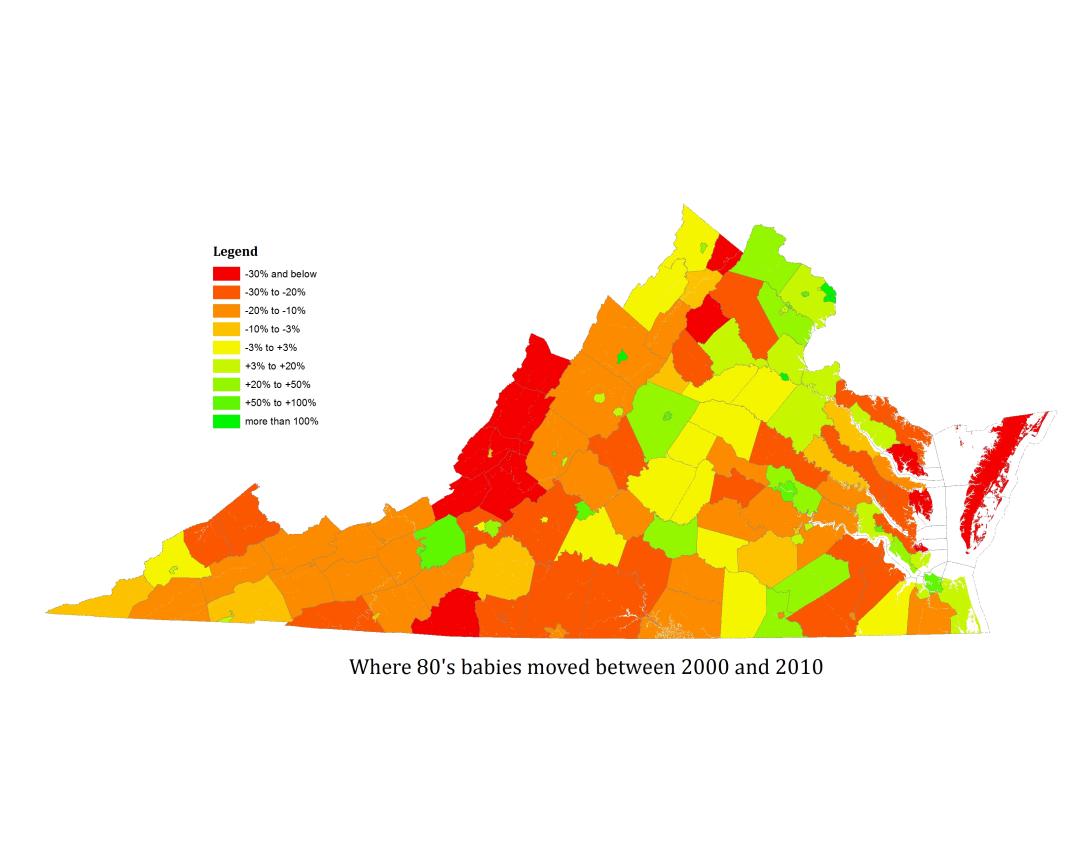
This map shows where the millennials moved between their teen years and their 20’s by depicting in each county the net gain or loss of people born between 1980 and 1990. As one might expect, most localities in Virginia lost anywhere from 10% to 50% of their young people. A more detailed look (by examining the age groups in 5-year increments) shows much bigger losses around the college years, followed by a slight rebound afterwards and larger growth in some job-rich cities and counties.
Poquoson City and Highland County are the most rapidly deserted, followed by the rest of the rural upland counties, southwest VA, and the eastern lowlands. While these areas all show net in-migration of older age groups (especially those in their 40’s and 50’s), their overall population has been shrinking as this rebound hasn’t been enough to reach replacement rate.
The biggest gainers are college towns and areas that are booming economically. Arlington, Alexandria, Harrisonburg, Fredericksburg, and Charlottesville were the top five destinations (proportionally) for 20-somethings during these ten years. Rural areas with struggling economies and some suburban areas are the biggest losers.
The next question is how these trends stack up against the previous cohort – those born between 1970 and 1980. Is this movement just part of the great circle of life, or are millenials somehow different from previous generations? The areas that have more 20-somethings than ten years before are largely the same areas that have more people overall – showing that overall growth tends to influence all age groups, but giving us little helpful information otherwise. So instead of mapping the raw change, I compared it to the county’s overall population trend.
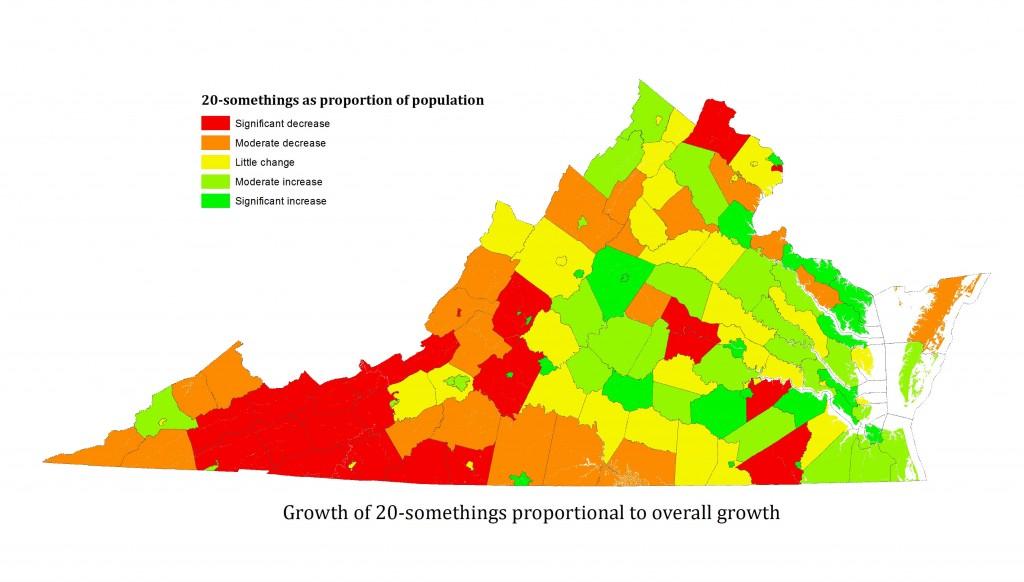
Here, counties in green have had a disproportionate growth of 20-somethings over the last 10 years, while in counties in red, 20-somethings declined as a proportion of the population. In some places, like Loudoun County, that’s because the number of young people has grown less quickly than other age groups. In others, like some of the counties in southwest Virginia, it’s because young people have left the county at a faster rate than other age groups. You might say that in the green counties, the growing number of young people is a key driver of overall growth. In red counties, the opposite is true. In yellow counties, the loss or gain of young people is business as usual.
The map largely supports the thesis that the current generation of 20-somethings are more likely to move to cities than the previous generation. Lynchburg, Petersburg, and Richmond lead the way here, with strong showings from Arlington, Charlottesville, Norfolk, Fredericksburg, Harrisonburg, and other cities that have undergone a great deal of revitalization recently. But there are also some surprises. The counties of the Northern Neck appear to be getting more young people out of this generation than they did from the last (or at least they aren’t losing them as quickly). Hampton Roads as a whole is attracting more 20-somethings than it did previously – and they are more interested in living in suburban municipalities. Young people have also been less important to the growth of suburban NoVA than some might think. Some of this change may be due to the growing number of people returning to graduate school or going to college for the first time. Changes in military bases and the addition of several rural prisons also have a huge impact on these numbers.
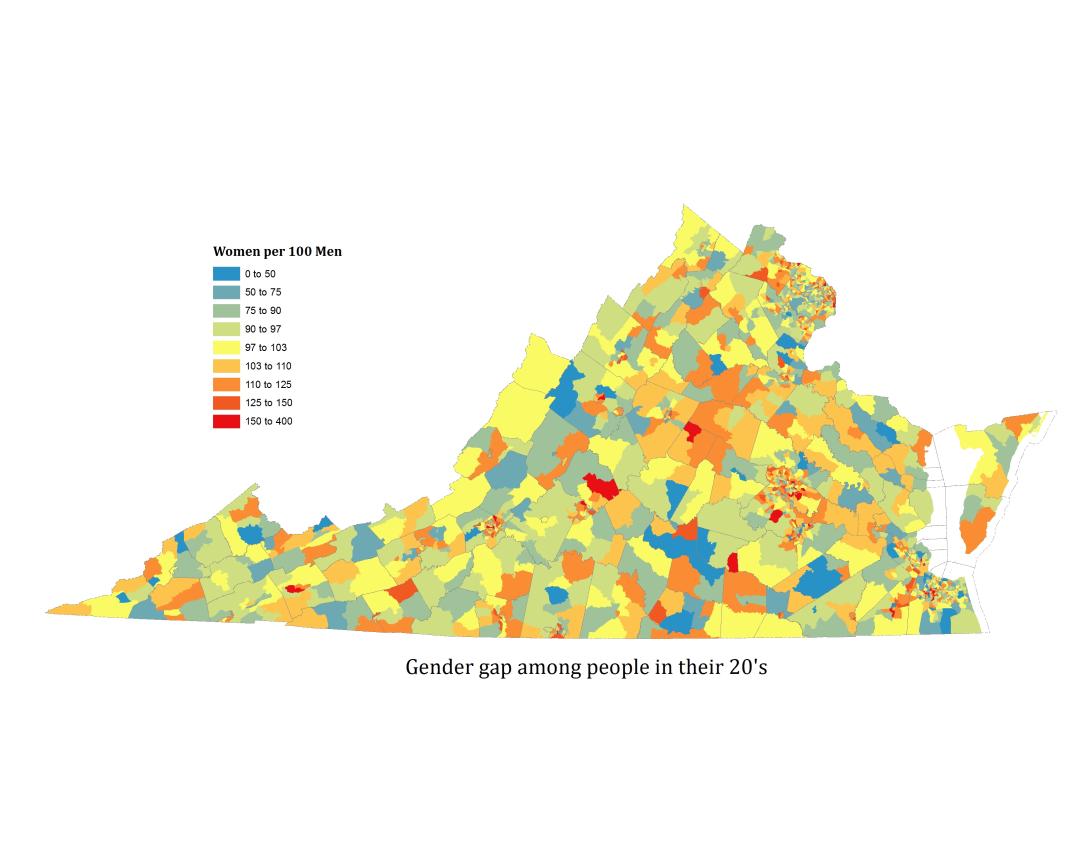
The Gender Gap
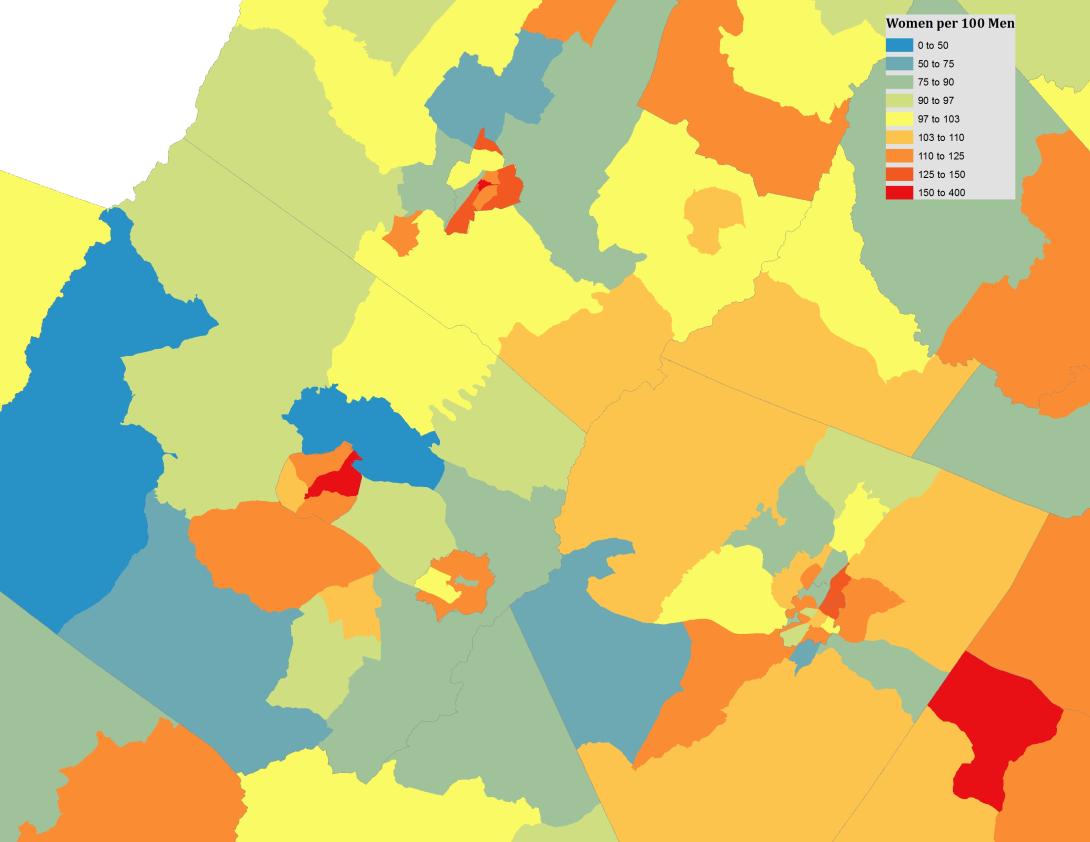
I’ve had to sit through more than a few conversations in which girls bemoan the lack of guys in their area. Turns out they’re not making it up. There is a pretty pronounced gender gap for 20-somethings in many regions. This map has several outliers that throw off the curve thanks to large institutions. Fluvanna County has 140 females per 100 males in the age group – probably due to the Fluvanna Women’s Correctional Facility. Staunton is close behind thanks to Mary Baldwin College. Greensville County has 33 women for every 100 men thanks to the prison population. Norfolk has Norfolk Naval Station and other military bases. Other counties’ gaps aren’t quite as emphatic, but also have fewer explanations.
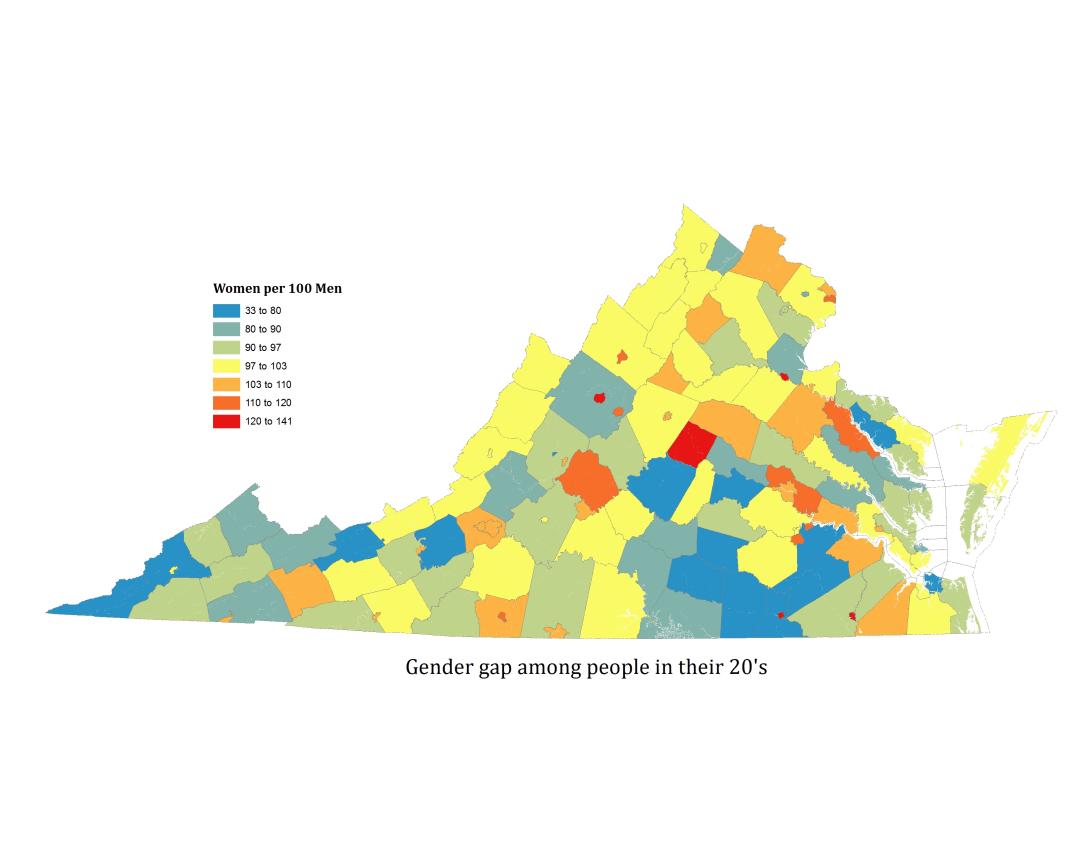
Depicting the gap proportionally masks its sheer scale in the major urban areas. Henrico County and Richmond City together have 4,000 more young women than young men. Arlington and Alexandria are almost 3,500 young men short. At the other end of the spectrum, Norfolk and Virginia Beach together are short 14,000 20-something women.
Overall, women are much more likely to live in cities – especially college towns and areas with higher education levels and better economies. In fact, density correlates mildly with an area having “too many” women. Perhaps there is a Green Acres effect, but there are some other much more verifiable conclusions. Men are more concentrated than women – usually in municipalities with military bases, prisons, or large natural resource extraction industries (see North Dakota) – which are often less dense, the exceptions being in Norfolk and Virginia Beach. There may also be a connection to the growing achievement gap between the sexes and the increasingly disproportionate percentage of college graduates who are women. VMI and Virginia Tech appear to buck the trend.
The importance of prisons to this map cannot be overstated and is an unfortunate reminder of the large number of young men who are currently incarcerated. I may do a follow-up post on the gender gap in the near future.
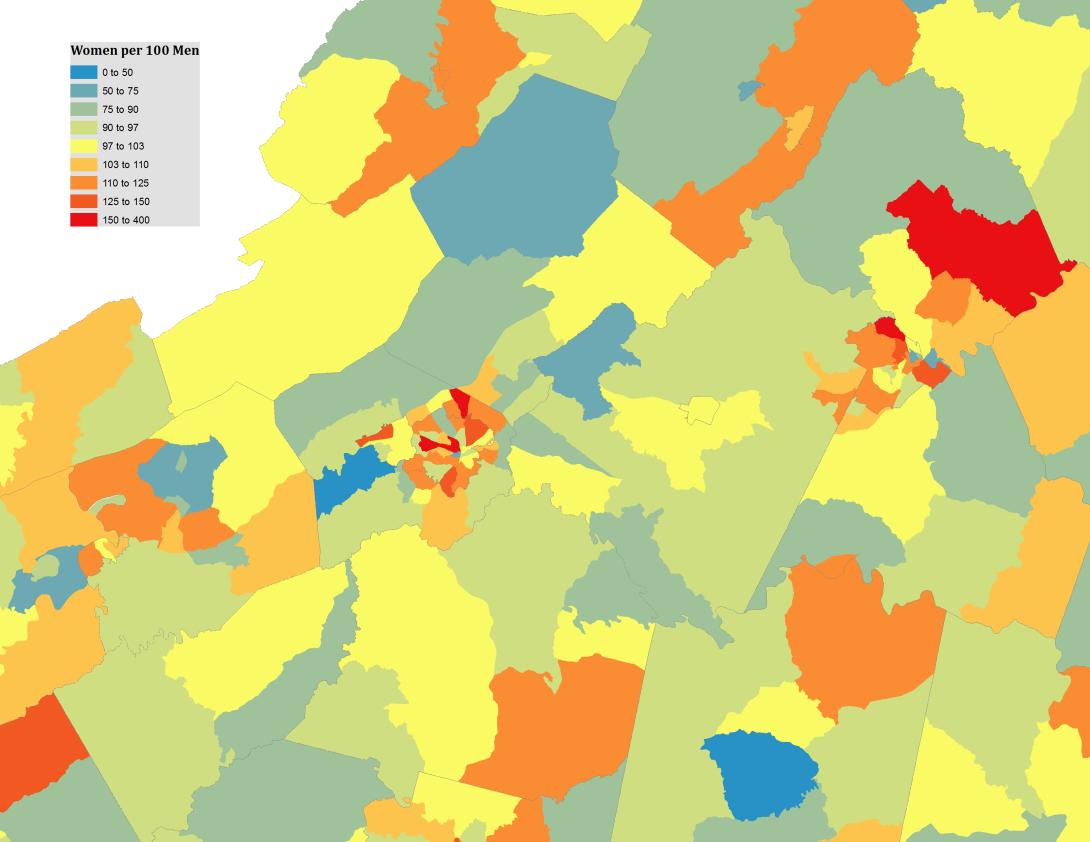
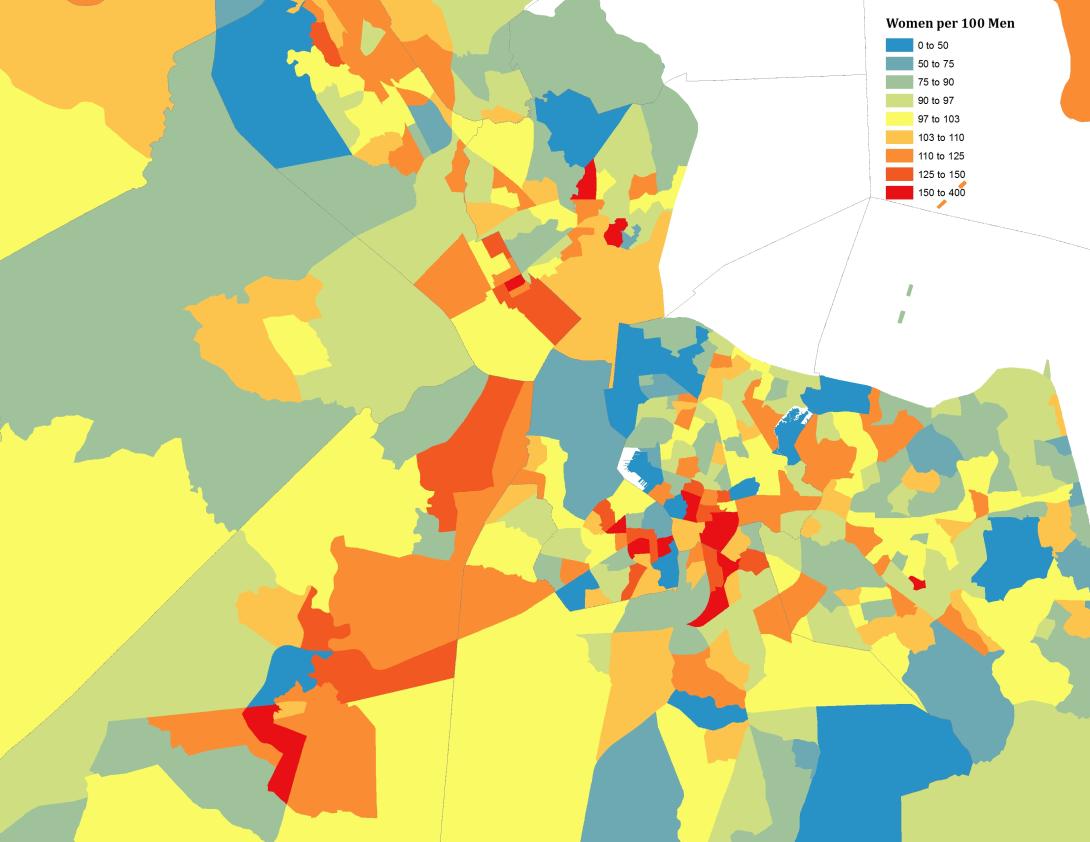
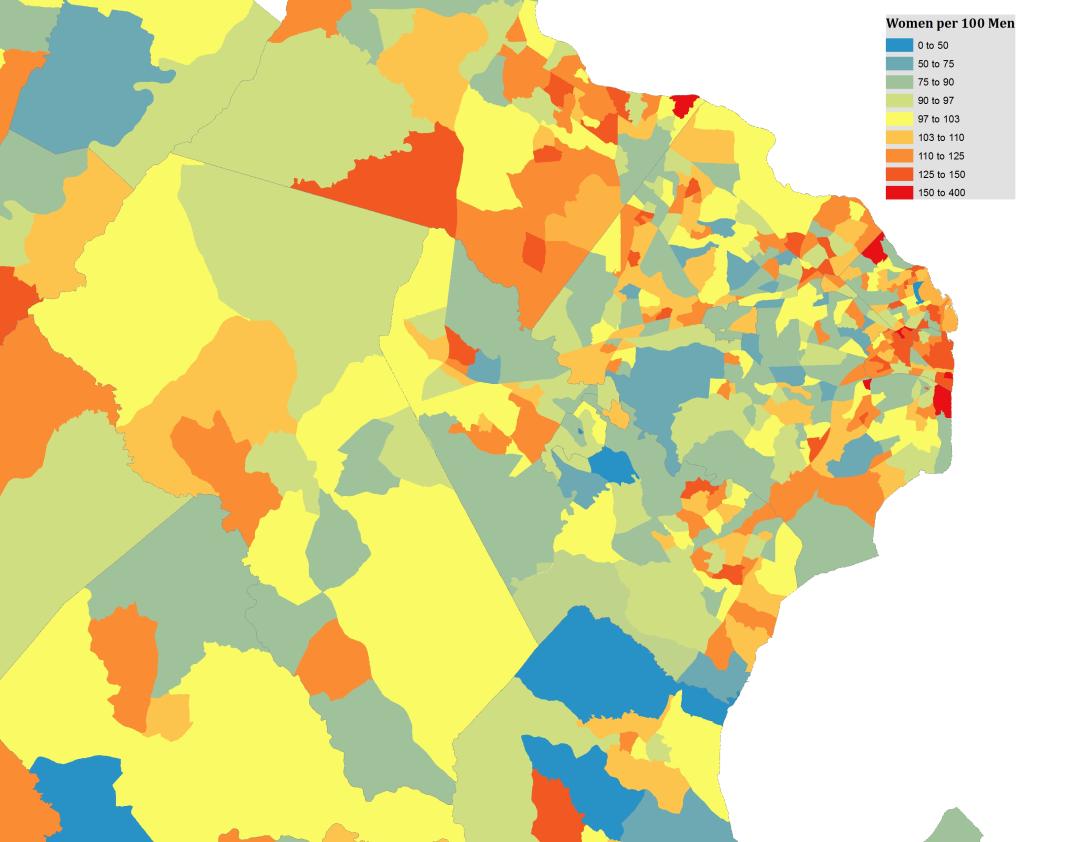
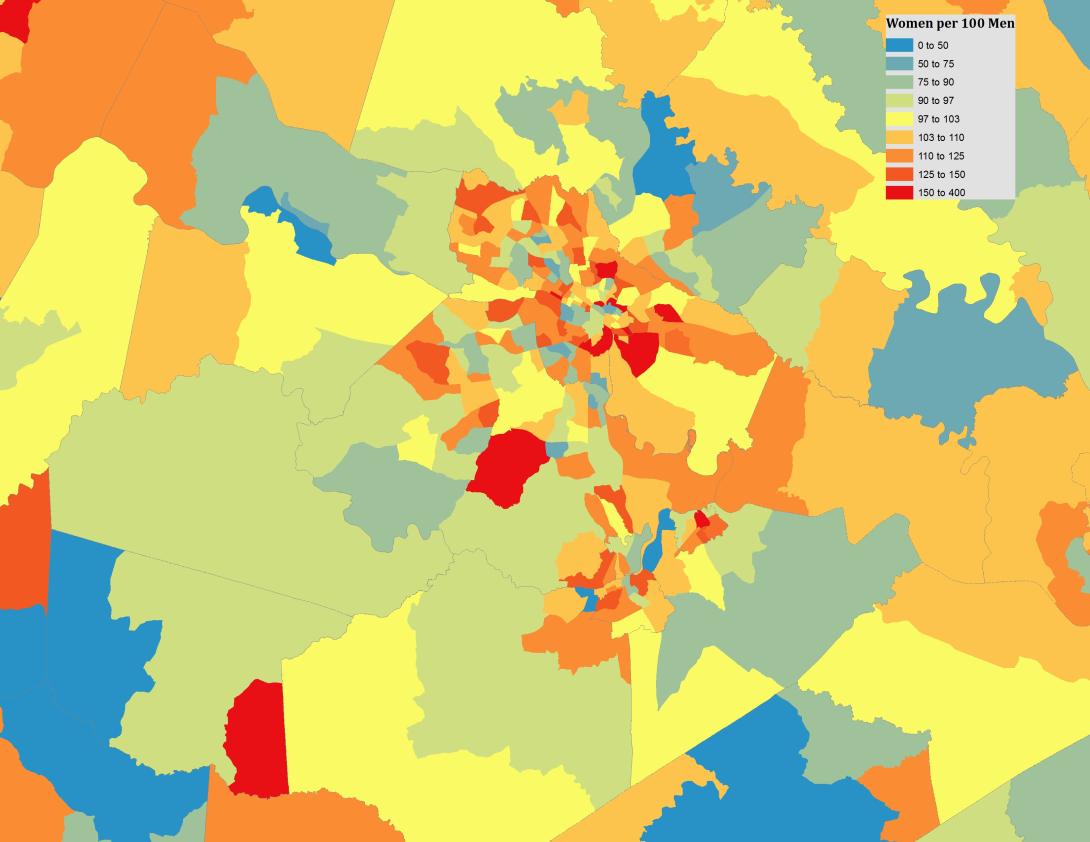
Here are some more detailed maps of the gender gap by census tract:
Hampton Roads
men at the naval base, women downtown
Nova
Richmond
Harrisonburg, Staunton, Waynesboro, and Charlottesville
women at JMU, Mary Baldwin, and to a certain extent UVA. Men are out in the county or AWOL.
Lynchburg, Roanoke, and Montgomery County:
