America’s shifting centers of gravity
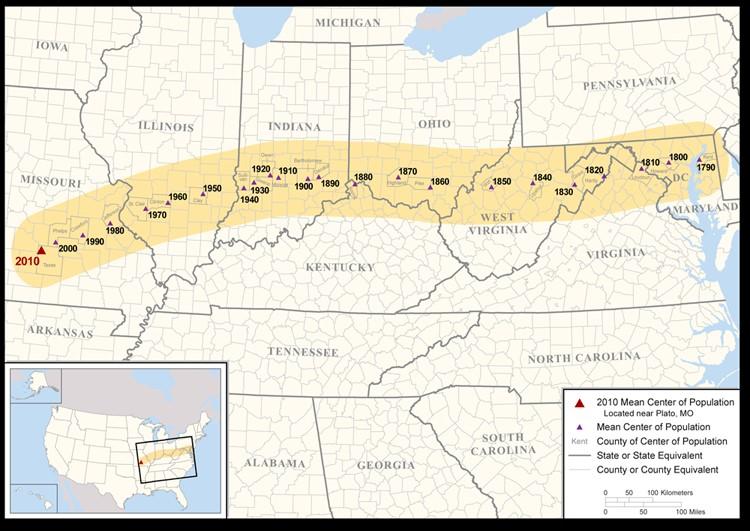
The map below was one of the more interesting maps produced after the census in 2010. It shows how the United States’ demographic center of gravity has shifted westward each census since the first in 1790. The center of population is essentially the point on which a flat, firm map of the United States would be perfectly balanced — somewhat like a seesaw — if all its residents had the same weight.
What is this map good for?
There are a myriad of ways to map a population, but as useful as maps can be they typically contain a large number of data points which can make interpreting them difficult. The main strength of a center of population map is its simplicity, just the location of America’s center of population can reveal a good deal about the country. With some historical knowledge a map of the country’s previous centers of population can reveal a number of macro trends in U.S history. For example, in 1890 the Census Bureau announced that the western frontier had finally been settled, as the map above shows, the U.S center of population would move west much more slowly afterwards.
After looking at the United States map, I created the interactive map below of each state’s center of population over time to see if it would also show trends for the states and the country.
State Centers of Population
Looking across the states, a number of trends are visible. In many Sunbelt States, such as Florida and Nevada, the introduction of home air conditioning is apparent as their centers of population shift southward after 1940. Similarly, in many Rustbelt States, such as Michigan and Pennsylvania, their centers of population shifted towards manufacturing hubs after 1900. But following 1960, as U.S manufacturers began to decline, the states’ centers of population started moving away from manufacturing hubs. If there is an overarching trend it is that for over a century the center of population in most states has been steadily marching towards their largest city as an increasing proportion of the U.S population lives in large urbanized areas.
Virginia moves north

Among all the states, recent trends in Virginia have been particularly striking. Like the United States, Virginia’s demographic center of gravity shifted westward and southward during the 19th century and into the 20th century, as much of its population growth was concentrated in its southwestern counties. By the early 20th century, the majority of Virginia’s population was located within 60 miles of North Carolina along the Norfolk and Western Railway which connected Virginia’s mining and factory cities in the west with its port cities to the east.
During World War II, Virginia’s center of population shifted rapidly eastward, towards the port cities and Richmond which grew quickly during the war. After 1950, the center of population continued to shift rapidly eastward and then northward, as the Washington Metro Area grew to be one of the largest in the country. By 2000, most people in Virginia now lived closer to Washington DC than North Carolina, as Virginia’s demographic center of gravity moved north of the James River.
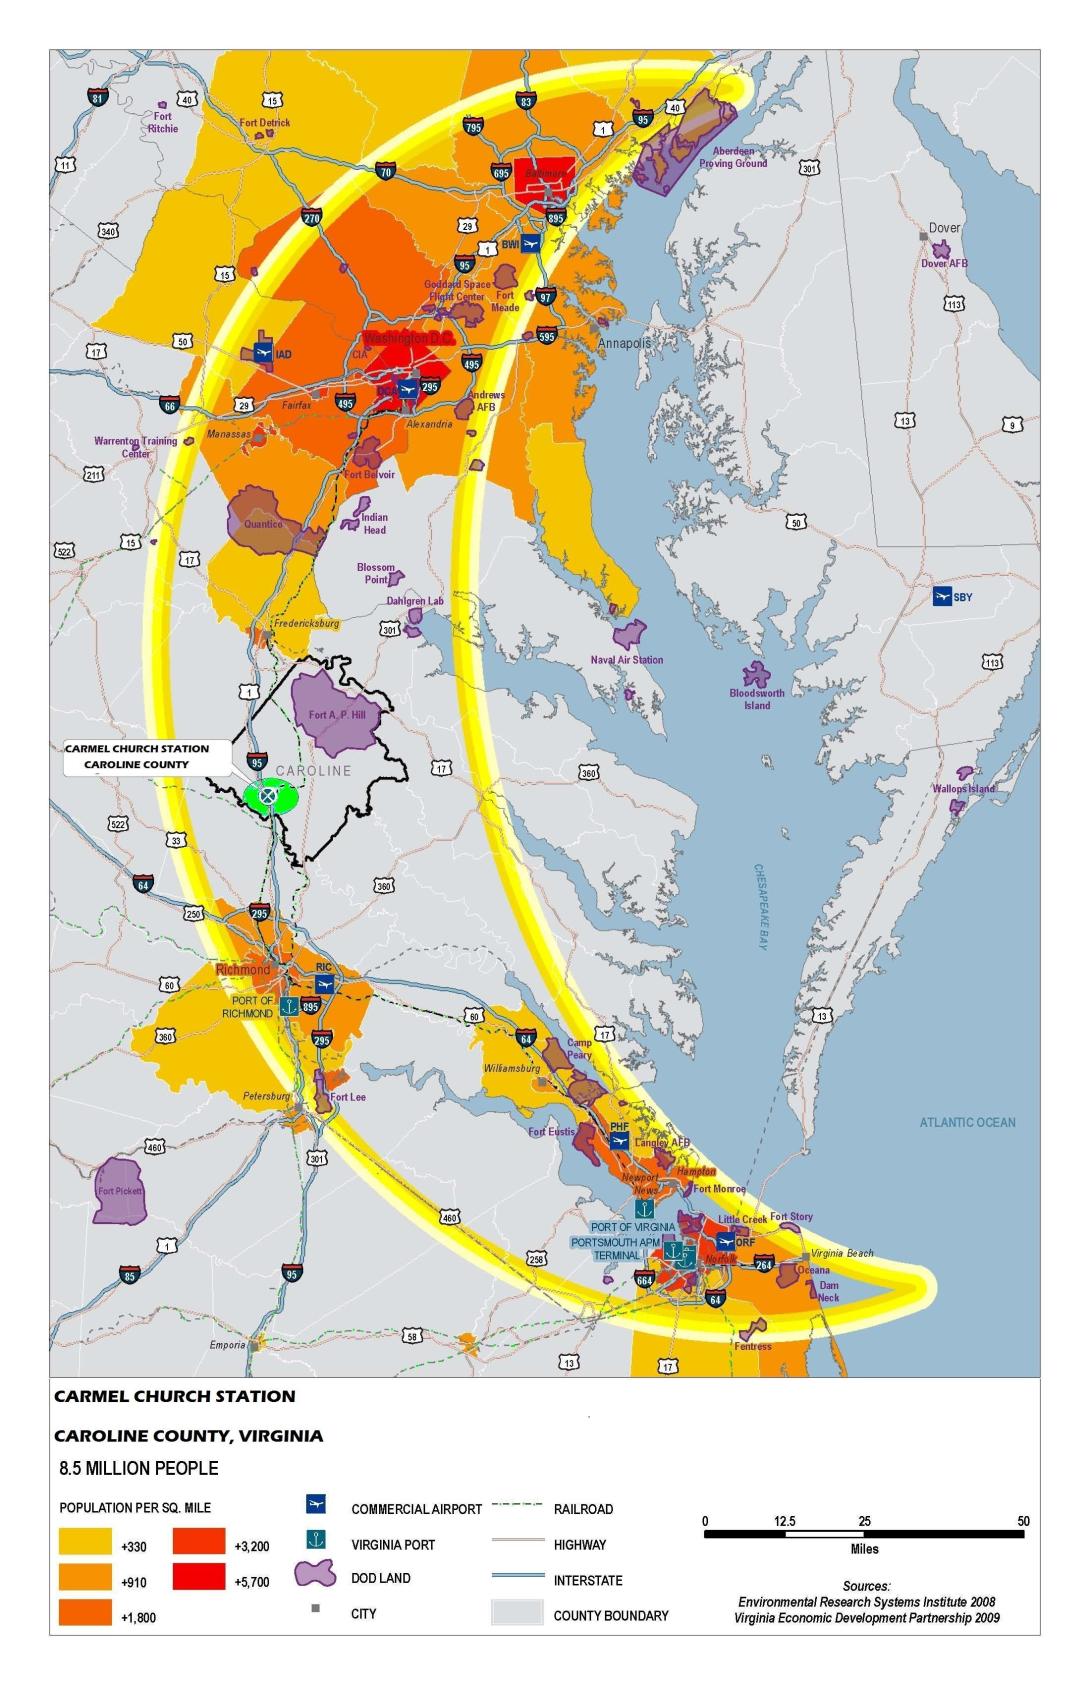
Today, Virginia’s center of population is located west of Interstate 95 between the Richmond and Washington DC metro areas. Since World War II, the distribution of Virginia’s population has been completely reoriented, from being positioned along an east to west railway line in southern Virginia to being located along the north to south interstate corridor which connects Virginia’s three largest metro areas: Northern Virginia, Richmond and Hampton Roads.