Are women in Virginia choosing to have children later in life?

According to the Center for Disease Control’s 2017 Vital Statistics Rapid Release, the provisional number of births for the U.S. (at 3,853,472) declined for the third year in a row since 2014 and was the lowest count in the last 30 years. Related fertility statistics also reflect this trend, with the average number of children per woman in the United States (1.76) hitting a 39 year low since 1978; while the birth rate reached a record minimum as well (60.2 per 1000 women aged 15-44).
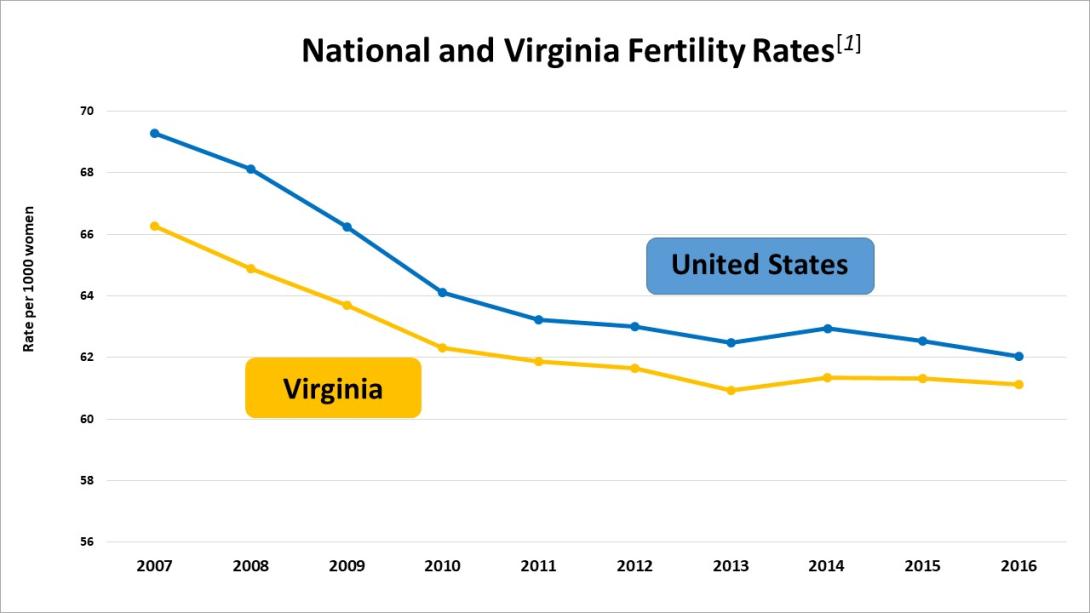
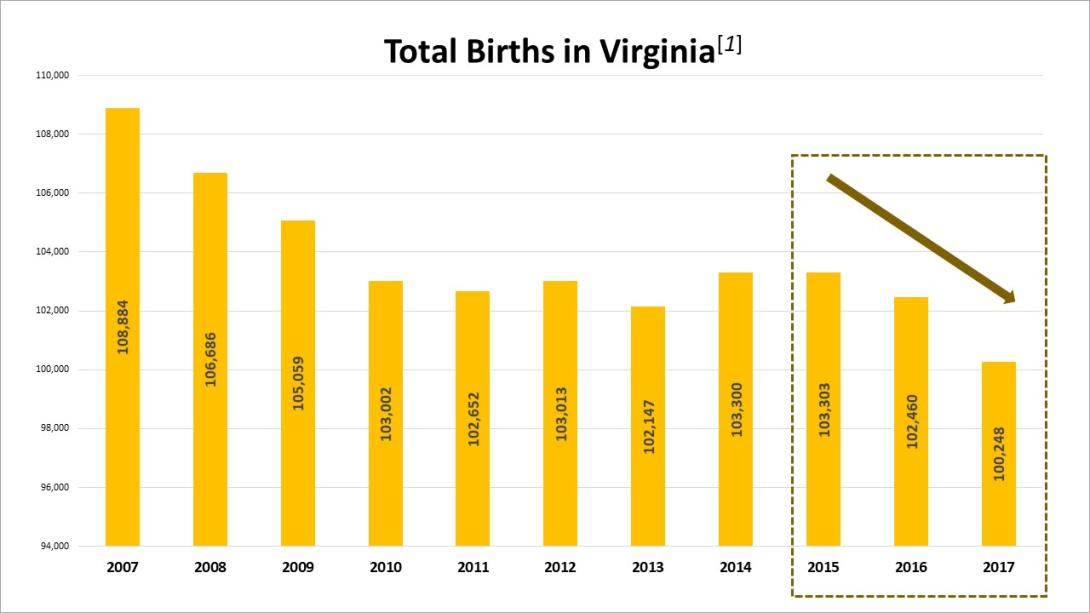
Compared to national statistics, Virginia appears to follow the majority of U.S. fertility trends and has consistently maintained a lower birth rate than the national average (as seen in the graph above). In 2016, Virginia experienced 102,460 births—the lowest since 2013—and the provisional 2017 estimates are lower still (at 100,248 births, as seen in the following chart). This is part of an overall pattern of decline in total live births per year, similar to the national pattern of decline between 2007 and 2016.
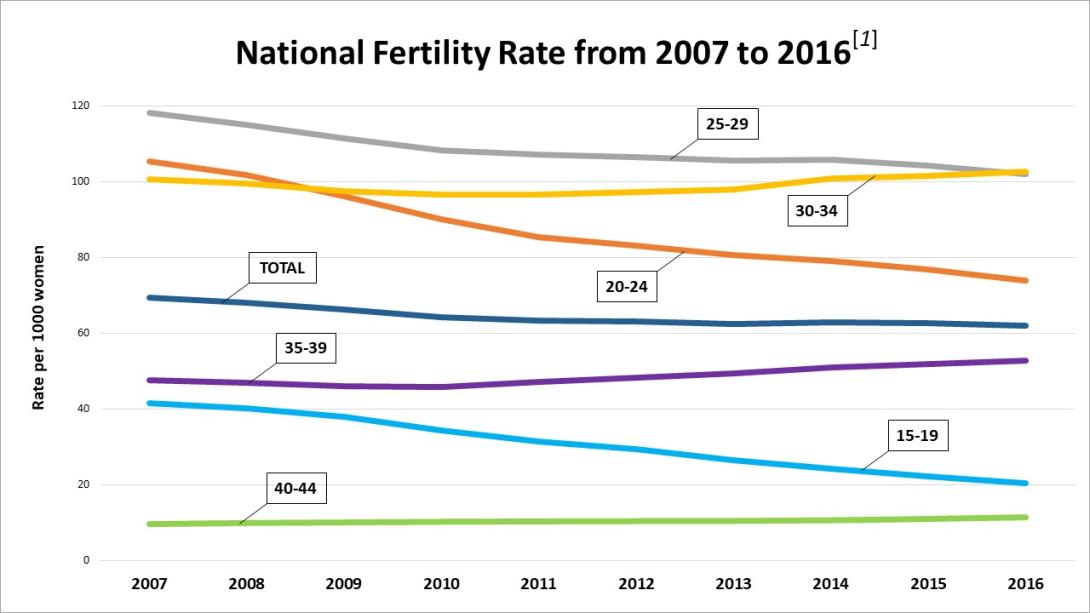
At the national level, (from the graph below) we see a notable shift in the age demographics of women who have given birth over the past decade, beyond just the decline of overall births. From 2007 to 2016, the fertility rates for women over 30 has seen an uptick (yellow, purple, green) with the 40-44 cohort being the sole group to have experienced increasing fertility rates since 1982. In contrast, women under 30 are demonstrating lower fertility rates (grey, orange, light blue) and those between 15-19 and 20-24 have both experienced record lows. Teenagers[2] especially have experienced an overall decrease in fertility, with a decline of 55% over the past 10 years, with further variations across age, race/ethnicity, and regions.
Overall, the national data demonstrates that women in the United States are choosing to have fewer children and give birth later in life. Data within Virginia also reflects this trend. According to the CDC, in 2007, women between the ages of 25-29 accounted for 27.6% of all Virginia births, making them the greatest contributors to the total births that year. By 2013, the order switched; women between the ages of 30-34 surpassed the 25-29 age group with respect to births. As of 2016, women between 30-34 contributed the highest percentage of births per year at 30.3%, while women between 25-29 contributed 28.2%. Overall, Virginia demonstrates a pattern of consistently decreasing general fertility rates among women in their teens and twenties, as well as increasing rates for women above 30.
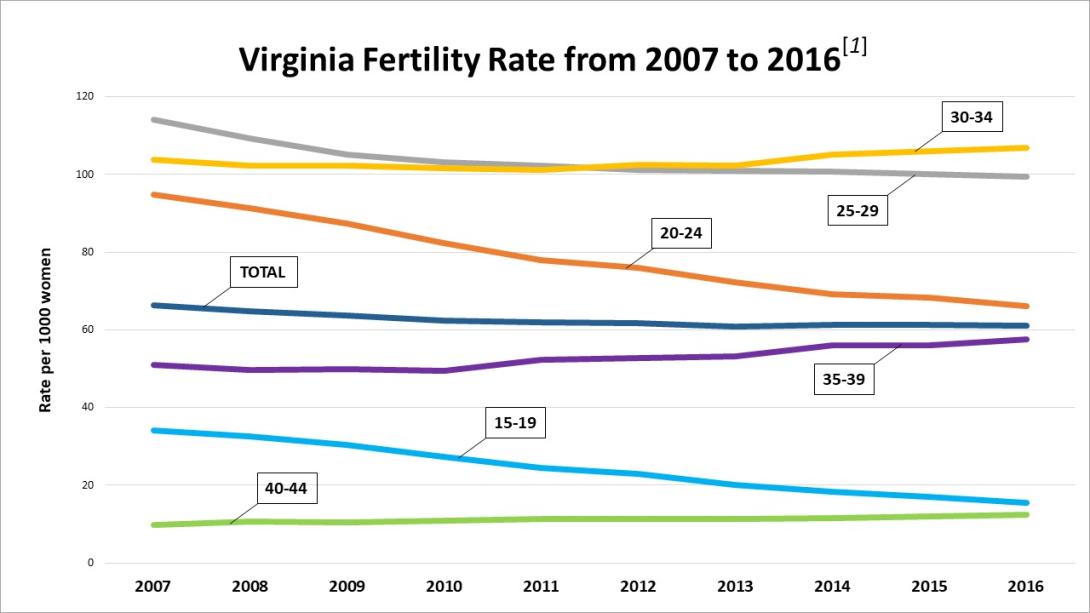
Since 2007, teenagers between 15-19 have experienced a 55% decline in birth rates, the most drastic decline in fertility of all age groups. Women between 30 and 34 have experienced a small increase in births (2.9%), but the sharpest increases occurred for women in their late thirties and early forties. In 2016, women between 35-39 and 40-44 had birth rates of 57.5 and 12.3, respectively, compared to 50.9 and 9.8 in 2007. The decreasing birth rates among younger women and the rising rates for women over 30 indicates that women in Virginia are, on average, choosing to have children later in life.
However, statistics are easy to misinterpret and need to be contextualized. While declining fertility may seem like a cause of concern for some and of celebration for others, we need to exercise caution while analyzing these birth numbers. As the Pew Research Center’s article – “Is U.S. fertility at an all-time low? It depends” argues that using measures (such as birth rates or average number of children born to a woman)[3] to demonstrate record fertility lows may not completely represent real changes in fertility. This is because fertility statistics are sensitive to the timing of births and age distribution of women in their child bearing ages, but may not explicitly take these factors into account in their formulae.
All of which points to the fact that maternal age is an important factor in all these fertility indicators as women’s child bearing choices evolve over time. Recent data shows more women are putting off having children, which could be due to a multitude of factors such as longer educational careers, greater labor force participation, family planning practices, or even the overall economic climate. This trend changes the underlying age-specific fertility rates, which means that in the past more women had children by their early 20’s whereas now women are increasingly choosing to delay childbearing into their late-20’s, 30’s and even early-40’s.
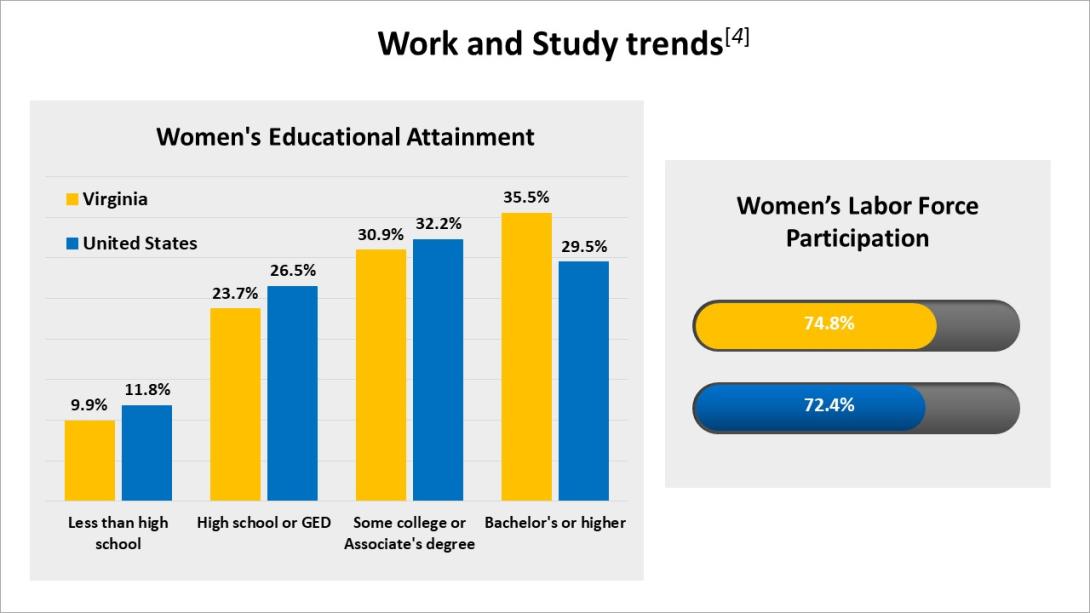
Relative to the national averages for 2016, Virginia experienced lower birth rates for all women under 30. For women 30 to 44, Virginia’s rates were higher than the national average. This falls in line with women in Virginia having more advanced degrees (BA or higher) and having a higher labor force participation rate than the country overall (as seen in image above).
All of this implies that greater numbers of women in Virginia are postponing childbearing, both over time as well as with respect to the national trends. Often this leads to a debate on whether fertility delayed is equivalent to fertility denied; i.e. deferral of childbearing in combination with biological limitations may lead to fewer births overall. On one hand, as women delay the start of their child bearing careers, they are left with a shorter window of time to have kids, and may be unable to fulfill their childbearing potential (involuntary decline). But on the other hand, with the passage of time the desired number of children or the preferred family size has changed, and may be smaller than before (voluntary decline in the number of children a woman may have). Furthermore, the current data looks at women who have not completed their childbearing years, so the late starters may catch up over their reproductive lifetime. In conclusion, the decline in fertility and delayed motherhood simply reflects an evolution in demographic trends.
_____________
Notes:
- Births data from Centers for Disease Control and Prevention https://wonder.cdc.gov/ and https://www.cdc.gov/nchs/data/vsrr/report004.pdf
- For instance as per the Office of Adolescent Health’s “Trends in Teen Pregnancy and Childbearing” report, in 2016, 74% of adolescents who gave births were older teens of 18 or 19 years. Across ages 15-19, Hispanics still have a higher teen birth rate (31.9 births per 1,000 adolescent females) than their black (29.3) and white (14.3) peers, but this rate has seen a substantial decline in recent years. Finally, regional differences also exist, with lowest teen birth rates being reported in the Northeast.
- Birth rate refers to Total Fertility Rate (TFR) which reflects the number of children a hypothetical woman would have in her lifetime based on the age-specific birth rates for a given year. Average number of children born to a woman refers to General Fertility Rate (GFR) which is the total number of live births per 1,000 women of reproductive age in a population for a given year.
- Education and Labor Force Participation data from American Community Survey 2016 (1-year estimate)


