Virginia: The state for crazy rich Asians?
After watching the movie “Crazy Rich Asians,” I wondered if it is accurate to label Asians in the United States and, specifically in Virginia, as rich. After delving into American Community Census data, I discovered that, in fact, Asians have been the wealthiest group in the United States for over three decades, and the wealthiest in Virginia as well.
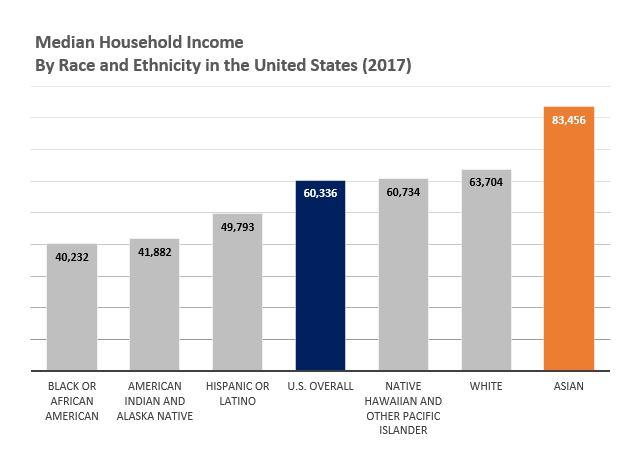
Based on the 2017 American Community Survey data, the median household income for Asian in the U.S. was $83,456, the highest among all races and ethnicities.
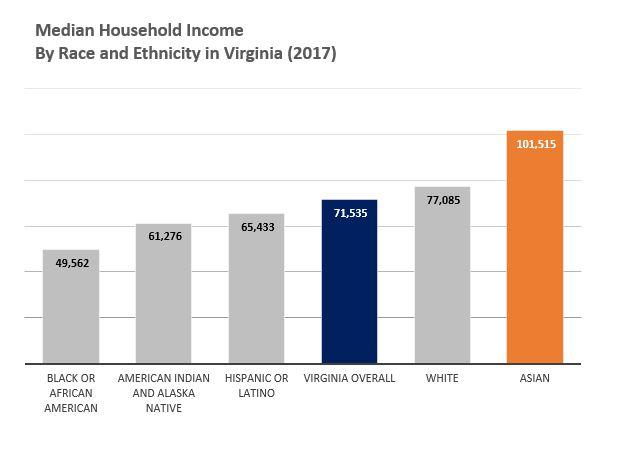
In Virginia, the Asian population has the highest median household income among all races and ethnicities as well.
Data from the Pew Research Center suggests that over the last three decades, the median household income for Asians has been consistently higher than other races. One of the main reasons is the Immigration Act of 1965, which attracted large numbers of Asians to move into the U.S. The law eliminated the use of national-origin quotas, and allowed mass entry from the wealthiest and most educated Asian groups in their native countries. This Act brought Asian professionals and technicians to U.S, increasing the income level of the Asian population.

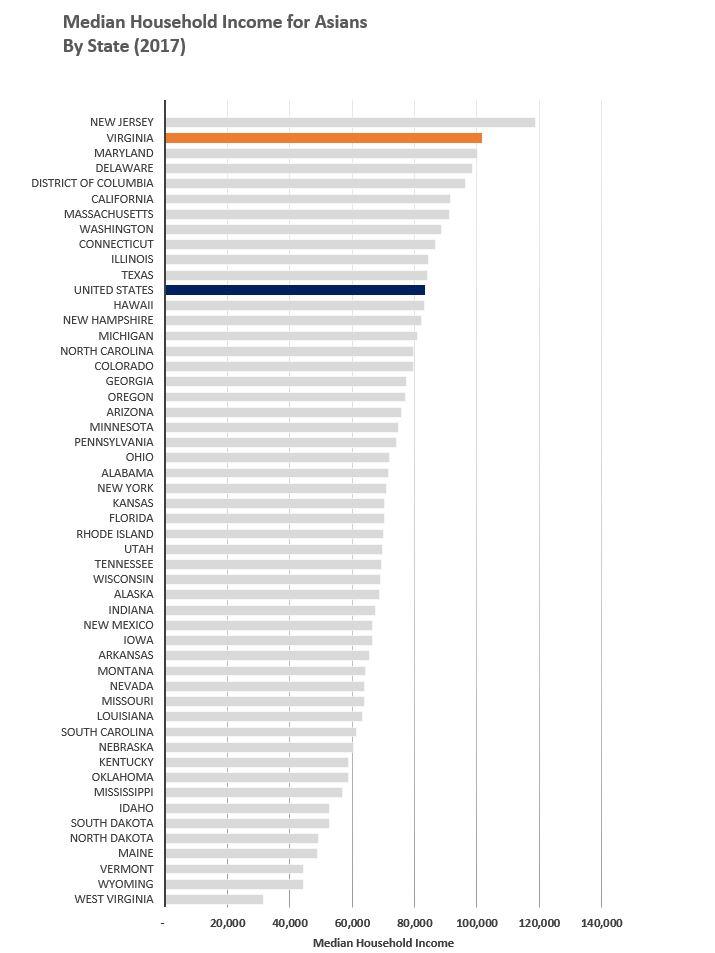
While the median household income level of Asians ranks the highest in the United States, it varies among the states. The median household income for Asians in Virginia is $101,515, only second to New Jersey. In Virginia, the strong labor force of Asians in STEM-related occupations, and the expansion of technology firms in Virginia’s larger metro areas, particularly in Northern Virginia, contribute to the high median household income of Asians in the Commonwealth.
Northern Virginia has one of the largest concentrations of technology jobs in the United States. It is a center for technical and service firms, and trade and professional organizations, constituting 20.7 percent of the total employment. Technical industries are the driving force of economic growth in Northern Virginia, and this trend is expected to continue. According to the Trailblazers project, jobs associated with Information Technology and STEM clusters are projected to have a growth rate of 20 percent and 10 percent respectively through 2024 in Northern Virginia.
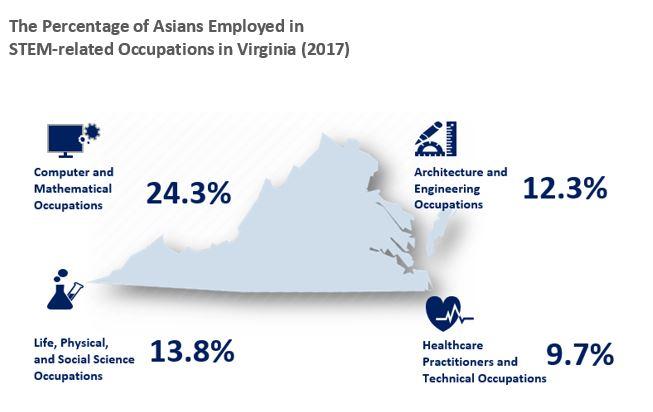
The percentage of Asians in Virginia’s labor force is 7.4 percent. However, for STEM-related occupations, the percentage is much higher. In computer and mathematical occupations, for example, Asians account for 24.3 percent of the total employment.
Generally, STEM workers earn two to three times more than non-STEM workers, according to the Pew Research Center’s analysis on STEM workforce in the United States. This is also the case for Virginia. The graph below shows occupation and annual mean wage in Virginia with STEM occupations highlighted. Please note, 19.6 percent of the occupations under “Management” are related to the STEM field, such as computer information managers, architectural and engineering managers, and industrial managers, but these management occupations are not considered as STEM occupations in the graph below.
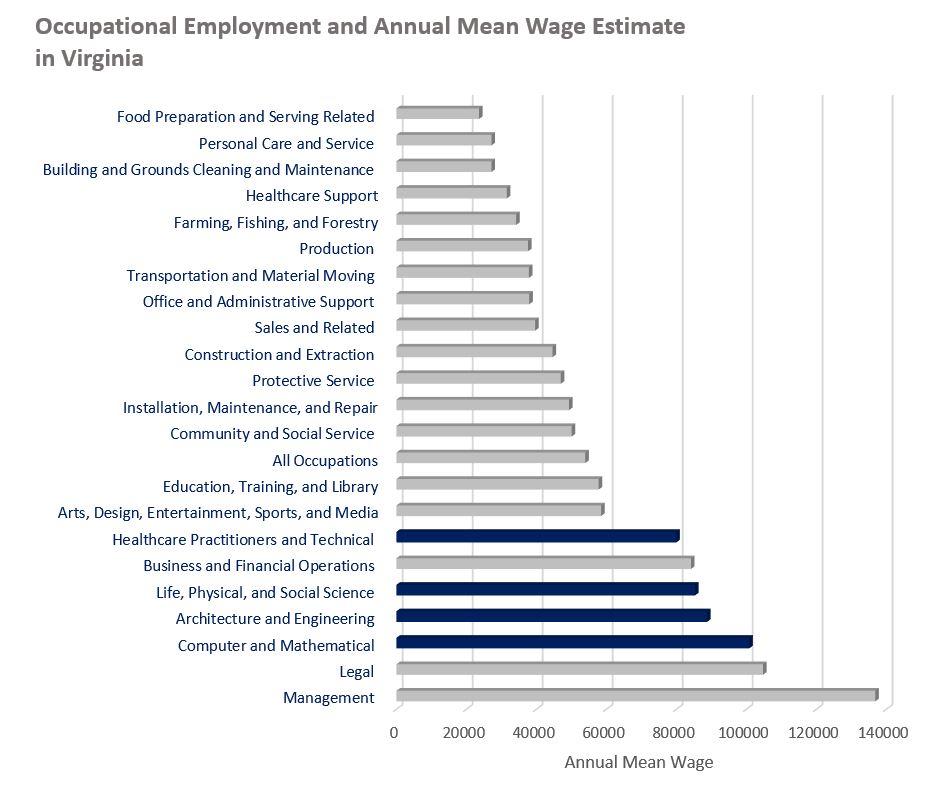
With large household incomes and high labor force participation in STEM occupations, Asian Americans are commonly perceived as a “Model Minorities”. However, despite the generalized term “Asian” throughout this post, Asian populations are quite heterogeneous, and income levels vary widely among Asian subgroups. I will be delving deeper into the income differences among Asian subgroups in my next post.


