Population Aging and Growing Dependency
In addition to producing total population projections for 2020, 2030, and 2040 for Virginia and its localities, we also produced projections of future population by age, sex, and race, and by age, sex, and ethnicity. Today, I want to highlight the age structure of projections for the state of Virginia, with specific attention to population aging.
Population aging is occurring worldwide, as improvements in living conditions and medical care lead people to live longer, healthier lives. Not only will larger numbers of individuals be reaching older ages (65 and older) than ever before, but a rising proportion of the population will be at older ages in the future. These population changes are anticipated to have wide-ranging impacts: families may face increased caretaker demands; new businesses and services may develop to serve this large population with new and changing needs; and, in the United States and other countries, population aging has long-term implications for the economy.
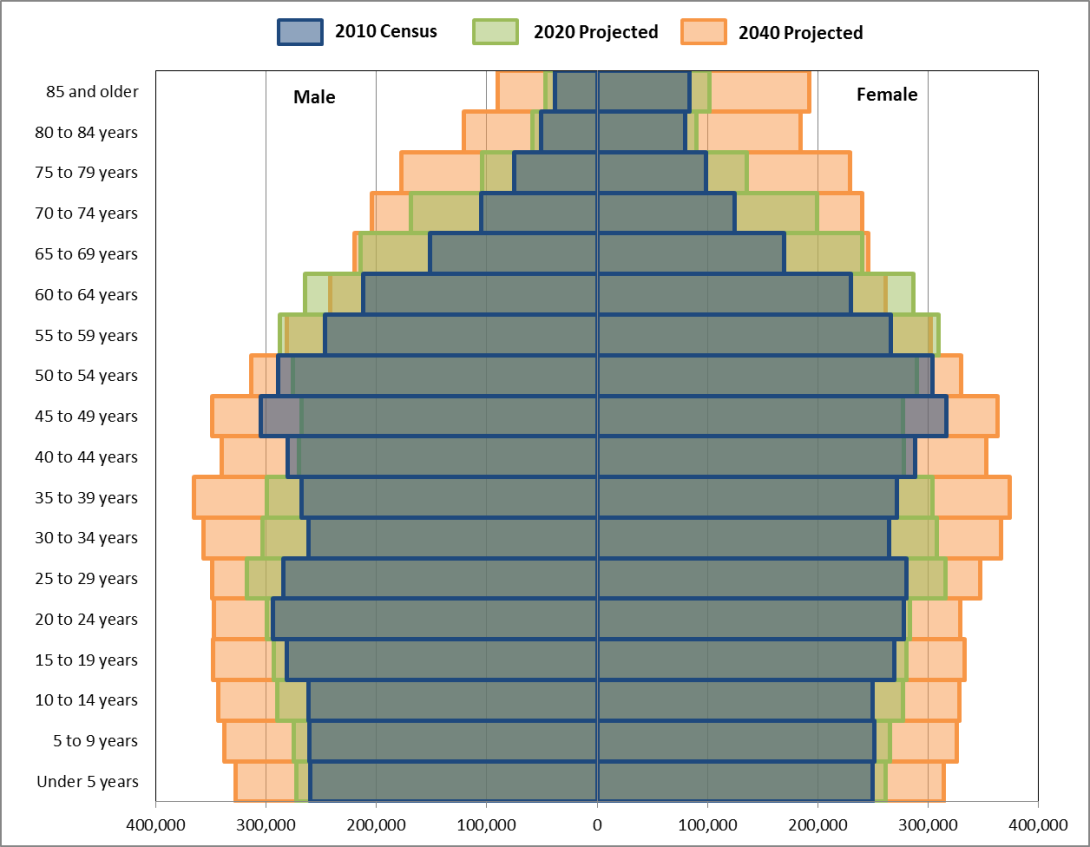
In demography, age distributions are typically presented in figures which display the distribution of the population by age and sex. Historically, these have been referred to as population pyramids; with sizable young populations and declining populations at older ages, population distributions at earlier points in time tended to resemble pyramids, with a large base and tapering top. With population aging, however, population age distributions appear increasingly rectangular due to significant increases in the population at older ages.
The figure below presents the age and sex distribution of Virginia’s population in the 2010 Census (the blue bars) and Virginia’s projected age and sex distribution in 2020 (green bars) and 2040 (orange bars). In 2010, the large Baby Boom generation was 45 to 64 (note that their children, the large cohort of Echo Boomers, also referred to as Gen Y or Millennials, were 15 to 29). The aging of the Baby Boomers is clearly shown, with the number of Virginians between 55 and 74 increasing substantially by 2020. By 2030, the youngest of the Baby Boomer generation will have turned 65, and the oldest Boomers will be on the cusp of turning 85. The dramatic increase in population at ages 80 and above is most marked in 2040, and many localities will be challenged to address the growing needs of their senior population in the coming decades.

Another way to think about population age structure is to examine dependency ratios. These provide an indicator of the potential burden on the working-age (i.e. tax-paying) population. Youth dependency is the ratio of the population under 20 to the population ages 20 to 64, while old-age dependency is the ratio of the population 65 and older to the population 20 to 64. The total dependency ratio is the sum of these two ratios. While the youth dependency ratio is projected to increase slightly between 2020 and 2040, the old-age dependency ratio is projected to skyrocket, increasing by more than 50% by 2030.

What does this mean? It means that, with no changes to current policies, the Millennial generation (15 to 29 in 2010 and turning 45 to 59 in 2040), may feel increasingly squeezed in the coming decades.
It is important to keep in mind that these projections are for Virginia as a state, and there are many differences within the state. For some localities, population aging may never be an issue. For others, it may be a developing issue or something that they are already facing. However, even if a locality’s age structure is not projected to change dramatically, the overall changes at the state and national level will have effects in local contexts.
To read more about the Cooper Center’s population projections and access data for all localities, please visit our Population Projections page.


