


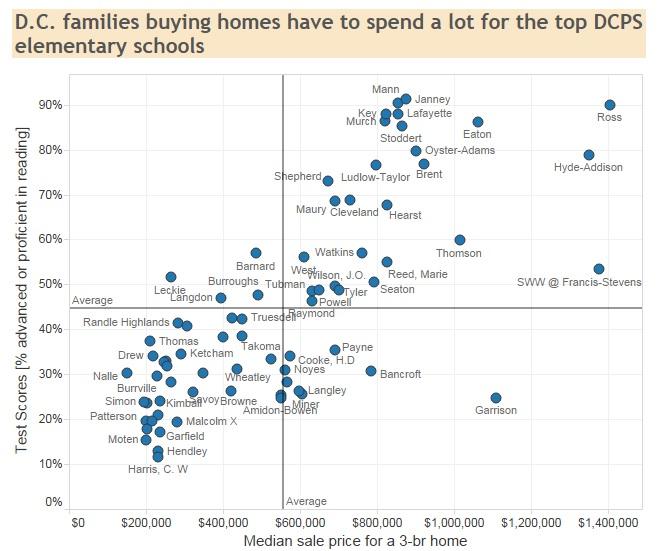
It’s a hard knock life: School test scores closely follow local income levels
When people begin house hunting, one of the most common criteria they consider is the quality of the local school district, not just for the sake of their children but also because schools often influence home values. The District of Columbia’s Office of Revenue Analysis recently mapped the standardized test results of each DC elementary school and found a strong correlation between test scores and home values. In Virginia, divisions with high Standards of Learning (SOL) test scores, such as Falls Church and Arlington, have attracted a disproportionate amount of their metro area’s population growth in recent years.
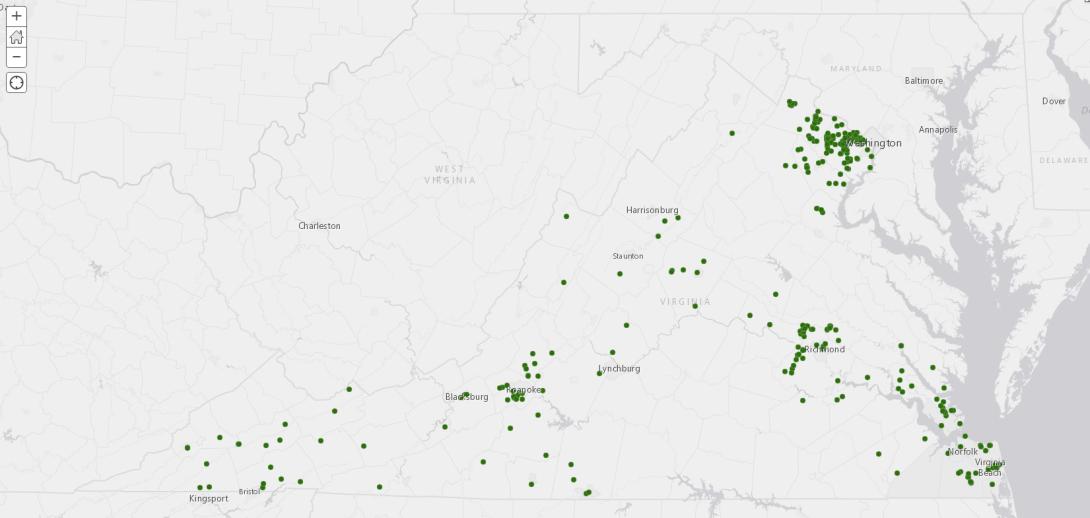
Since the Virginia Department of Education provides the SOL test results by school, it was relatively easy to map out the average SOL test pass rates by school in the interactive map below.
Virginia 2014-2015 SOL Pass Rates by School
View larger map
To see results for individual schools or to explore the map, open a full page version of the interactive map using the link above.
Overall, schools with highest SOL test pass rates (colored green) are concentrated in the outer suburbs of Virginia’s metro areas, where much of the newest housing is available and poverty rates are typically lowest. On the other hand, schools with the lowest SOL pass rates (colored red and orange) are much more likely to be located in the central part of urban areas and in older suburbs.
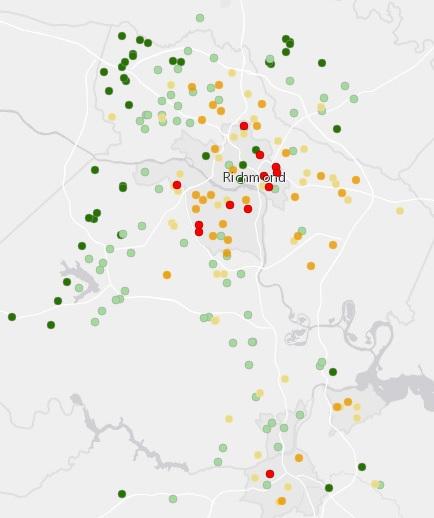
The problem with this pattern is that it supports a type of self-perpetuating cycle. Middle class families often move to neighborhoods with new housing and high performing schools. Both factors price out most families with lower incomes. Only when the housing has aged enough can many lower income families afford to move there. By then, many middle class families have moved further out and school test scores have fallen. This cycle has repeated itself across the U.S. and noticeably in the Richmond area.
However, the SOL data also shows this pattern isn’t always the rule. Some school divisions, such as Richmond and Norfolk Cities, have some of the lowest performing schools as well as some of the highest performing schools. Similarly, while the wealthy suburbs of Virginia’s metro areas account for a large portion of the list of schools with the highest pass rates, they do not dominate it as much as might be expected. Southwest Virginia, in particular, has a large number of schools with high SOL pass rates, despite also having some of the highest child poverty rates in the state.
While the SOL test data shows that school test results are often related to their neighborhood’s income levels, Southwest Virginia shows that some schools with a large portion of students from low income households still perform at the highest level.
____________
*A couple notes on the data, schools are not necessarily located in their divisions or attendance zones
School pass rates are calculated as the average pass rate across all SOL tests taken at the school in the 2014-2015 school year