


Power and Money: Why the Census is Important
The U.S. Constitution requires that every 10 years we take a count— or a census—of America’s population in all 50 states, the District of Columbia, Puerto Rico, and the Island Areas. The decennial census is the largest peacetime mobilization of the U.S. government, relying on each household to self- report the number of residents and their demographic characteristics. In addition, the census hires hundreds of thousands of temporary staff to help enumerate those who do not respond to the census form, making sure EVERYBODY is counted.
As we approach the 2020 census, the nation has changed considerably with a much healthier economy than nine years ago. It is vitally important that this count be successful and accurate, not only to help track these changes from the last decade but also to preserve our rights of equal representation. The census results determine substantial outcomes; democracy and lots of money are at stake.
Re-apportionment of House seats in Congress
The founding fathers decided that the number of seats in the U.S. House of Representatives would be apportioned by the number of people in each state. The population totals from the census determine the number of seats each state has.
The interactive map below displays the loss or gain in seats from the previous census, along with the projected change following the upcoming 2020 count. Following the 2010 census, eighteen states saw either a gain or a loss in their representation. Eight states gained at least one representative with Florida and Texas gaining the most with two and four additional seats respectively. Ten states, primarily in the Northeast and Midwest, lost one or more representatives, with New York and Ohio each losing two seats.
Figure 1: Change in Congressional Apportionment from the Previous Census*
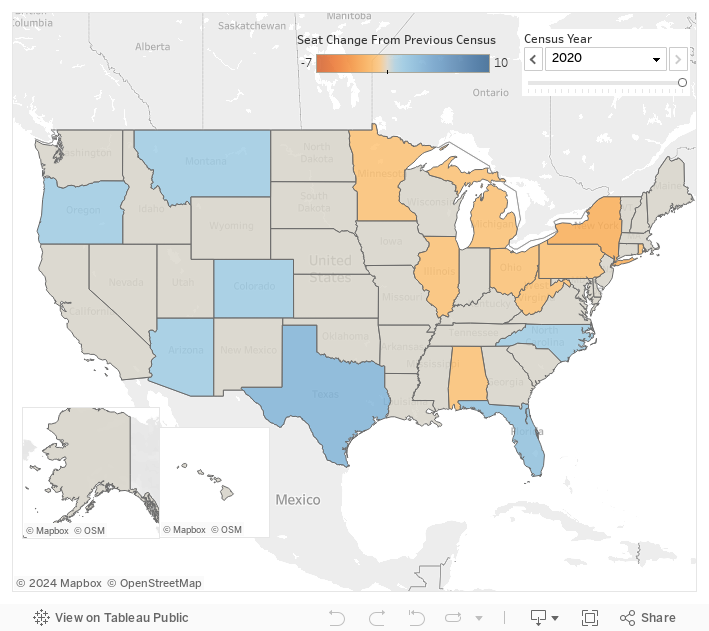
* 2020 Projections are based on 2010-18 Change shown in 2018 Population Estimates, Generated by Census Bureau 12/19/2018 and calculated by Election Data Services.
Looking to 2020, population projections suggest a ten-seat change over 16 states across the nation, according to Election Data Services. States projected to gain single seats include Arizona, Colorado, Montana, North Carolina, and Oregon, while Florida is set to gain two and Texas three. Single seat losses are again expected to occur in the Midwest and Northeast sections of the nation, including Alabama, Illinois, Michigan, New York, Ohio, Pennsylvania, Rhode Island, and West Virginia, as well as possibly California and Minnesota. All other states would keep the same number of representatives they were awarded in December 2010 when the official 2010 census numbers were released.
Congressional apportionment also impacts the Electoral College and the election for President. It should be noted that the 2020 Presidential election and resulting Electoral College will occur before the results of the 2020 census are released by December 31, 2020.
Redrawing of congressional district boundaries
The official census count is also utilized to draw district boundaries. Voting districts at the national, state and local levels, including congressional and state legislative districts as well as school districts and voting precincts, are delineated based on the results of the decennial census. Redistricting occurs following a census for two reasons. First, new districts must be drawn when a state gains or loses congressional districts as a result of the apportionment of congressional districts to the states. Second, even if the number of districts does not change, governments must redraw districts so that the districts have equal populations. New districts across the country will go into effect in 2022 and will remain until the next census in 2030.
This is exceptionally important considering the recent efforts to challenge and remove gerrymandered districting. Over the last two decades, political manipulations to legislative districts have grown increasingly common and sophisticated. The majority of states let their legislatures draw districts, with the party in power having considerable influence over district boundaries. There is a growing movement toward alternative approaches to map drawing and in recent years, there has been a significant increase in efforts to protect the redistricting process from abuse through redistricting reform.

Following the 2000 and 2010 United States census, Virginia neither gained nor lost congressional seats. Figure 2 displays how the boundaries of Virginia’s eleven districts have changed with redistricting resulting from the decennial census. Virginia is expected to again be allocated 11 congressional representatives following the 2020 census. The boundaries of those districts will depend on multiple factors including the outcome of pending redistricting legislation and the political composure of the Virginia General Assembly in 2020.
Virginia is among the 35 states in which federal and state redistricting is planned and enacted by the state legislature. The Virginia General Assembly has been majority Republican since 2015 (with the house alone being Republican controlled since 2000) resulting in redistricting maps tending to favor the GOP. However, the current state legislative session is looking at multiple bills to reform its redistricting process, including an amendment to establish a bipartisan panel made up of citizens and legislators.
District maps are frequently challenged in court after redistricting. Following the 2010 census, Virginia Legislature’s 2012 redistricting of the 3rd district was found unconstitutional and replaced with a court-ordered redistricting on January 16, 2016 for the 2016 elections (figure 3). In addition, The Virginia House of Delegates boundaries are currently being challenged in court and federal judges recently approved a redistricting map for the state legislative body to be enacted before the 2019 elections. Regardless, Virginia is set to redraw all of its legislative boundaries in 2021 along with the rest of the nation.

Allocation of federal funding
Money is another important reason that the U.S. conducts a census. The federal government decides how much funding to give states, counties, and cities by looking at the detailed census data. That means money for updating schools, building new hospitals, repairing broken roads, and maintaining public utilities like water, sewage, and electricity.
Decennial census results are essential to the equitable and judicious distribution of federal program dollars to states and local areas. Analysis from the George Washington University indicates that about 300 federal programs geographically allocate over $800 billion a year based on census-derived statistics. An accurate count ensures those dollars are distributed fairly. An inaccurate count would not change that overall dollar amount, just how it is spent. According to an additional report by GWU, the median FY2015 loss of state funding per person missed in the 2010 census was $1,091.
Recent studies also report that census-based federal datasets are used by Congress to geographically allocate close to $1 trillion in funding. The report, Distributing Federal Funds to Rural America identifies 55 census-guided programs specifically targeted to rural communities. These programs distributed $30.7 billion in FY2016.
Figure 4: Distribution of FY 2015 federal funding from 16 large Census-guided programs
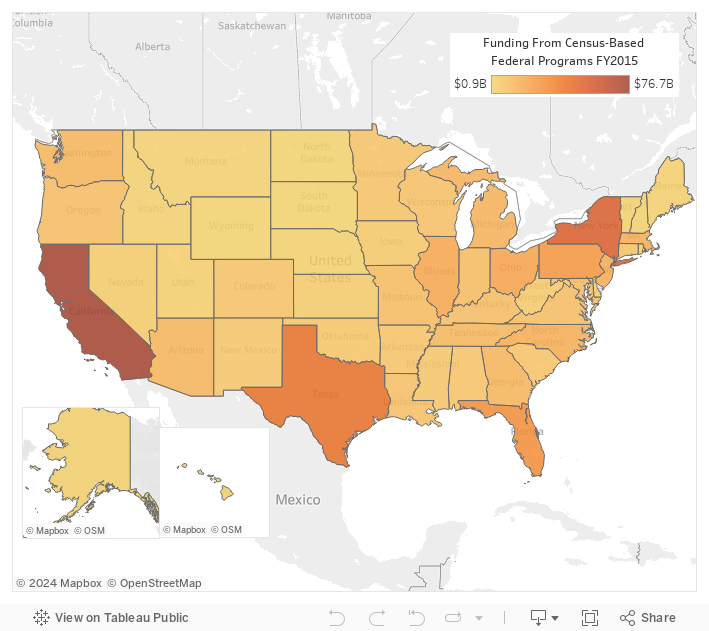
Source: Reamer, Andrew. COUNTING FOR DOLLARS 2020: The Role of the Decennial Census in the Geographic Distribution of Federal Funds. Report. Institute of Public Policy, George Washington University. March 19, 2018.
Conclusion
James Madison stated in defense of the census or “great enumeration” that only with a proper accounting would public officials be able to “rest their arguments on facts, instead of assertions and conjectures.”
A successful and accurate census will ensure: (1) equal and fair representation, (2) that every community receives the funding to which they are entitled; and (3) that policymakers can make better informed decisions.

