U.S. residents love a metropolis
The Census Bureau came out with a new special report in September about the patterns of population change in U.S. metropolitan and micropolitan areas from 2000 to 2010. The report is chock-full of data about the most populated areas of the country, and the authors have turned all of that data into lots of brief take-aways, useful maps, and nice-looking charts for data users.
There is too much in this report to cover in a single blog post, so for this one I’ll give a brief summary of Chapters 1 and 2, which cover the basic information about these areas and give an overview of the population change over the last decade.
“Metropolitan statistical areas” were developed as an official concept during the 1940s, when “it became evident that the value of metropolitan data produced by federal agencies would be greatly enhanced if agencies used a single set of geographic definitions for the nation’s largest centers of population and economic activity.”
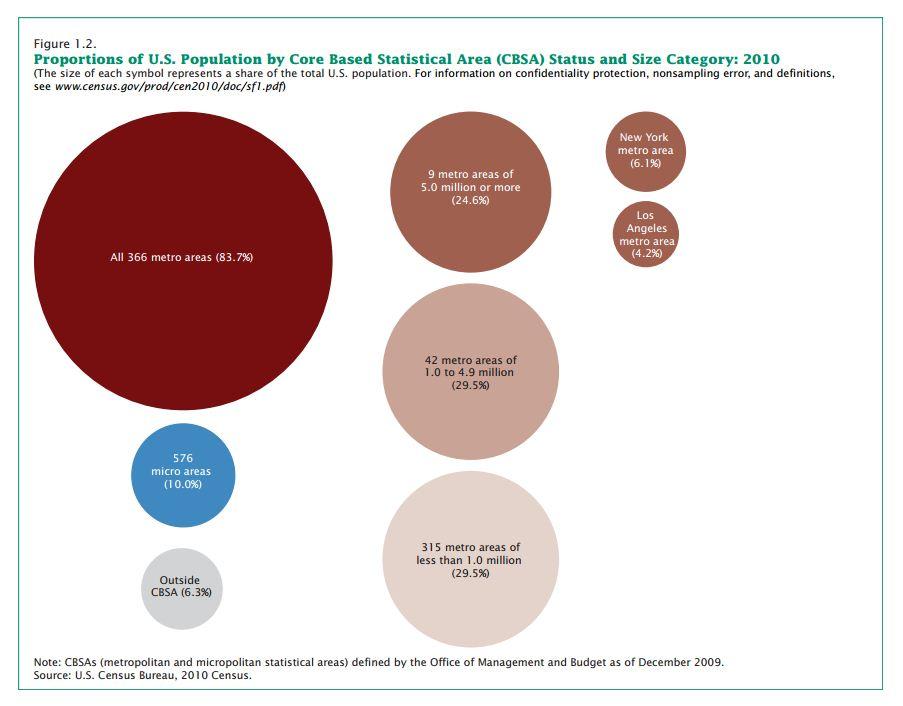
A metro area, as it’s more commonly called, is an “area with a large population nucleus together with the adjacent communities that have a high degree of social and economic integration with that nucleus.” Metro areas contain at least one urban area of 50,000 people or more. In 2003, “micro areas” were introduced as a new concept. These new, smaller areas are essentially the same as metro areas, they just contain a population core of 10,000-50,000 residents. These areas, while not even covering half of the U.S. land mass, cover the vast majority of the population in the U.S. – 84 percent of people live in a metro area and another 10 percent live in a micro area.
But the U.S. population is even more concentrated than the statistics above make it seem. As you can see in the graphic below (click for full size), more than one out of every ten people live in New York and Los Angeles alone.

The five most-populated metro areas in the U.S. are New York, Los Angeles, Chicago, Dallas, and Philadelphia and the five most-populated micro areas are Seaford, DE; Torrington, CT; Hilton Head, SC; Hilo, HI; and Daphne, AL.
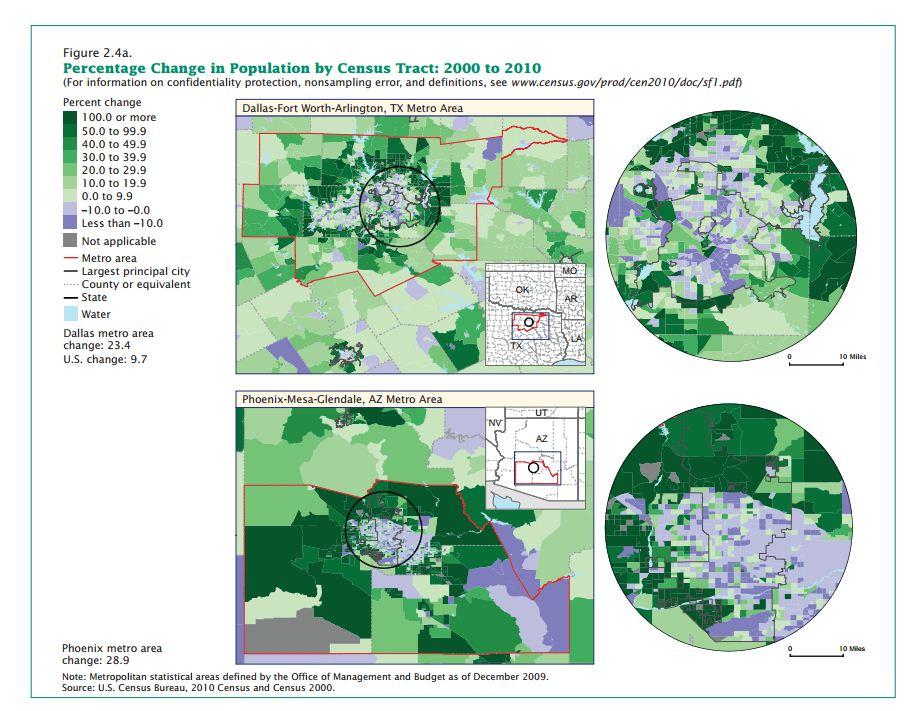
In total, the U.S. population grew by 27.3 million people between the 2000 and 2010 Census. Nearly all of that growth occurred in metro or micro areas; just 1 percent of all the U.S. population growth over the decade occurred in the rural areas. Metro areas grew by almost 11 percent, with micro areas growing by 6 percent and rural areas growing by 2 percent. The fastest-growing metro areas were located in the South and the West. The Census Bureau also found that in many of the larger metro areas, most of the population growth occurred in outlying tracts of the urban areas. This image (click for full size) from the report shows this pattern in the Dallas area (top) and Phoenix area (bottom). The red line outlines the metro areas while the purple shading shows population decline at the urban core and the green coloring shows population growth on the outskirts.

In my next blog post I’ll give an overview of the report findings concerning population density. The Census Bureau used a different density measure than we typically see, and the findings are very interesting.


