Metropolitan Cross-Sections: College Graduates
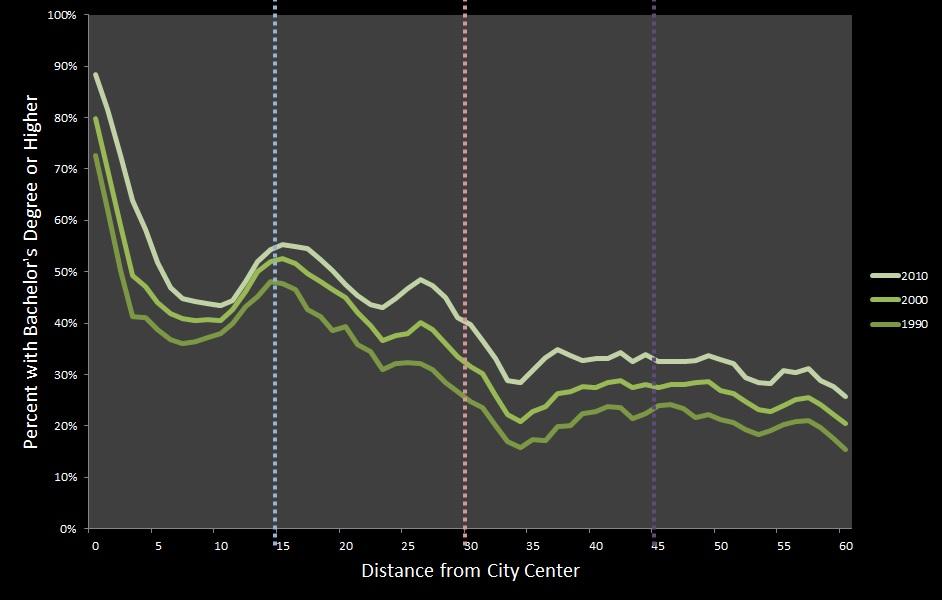
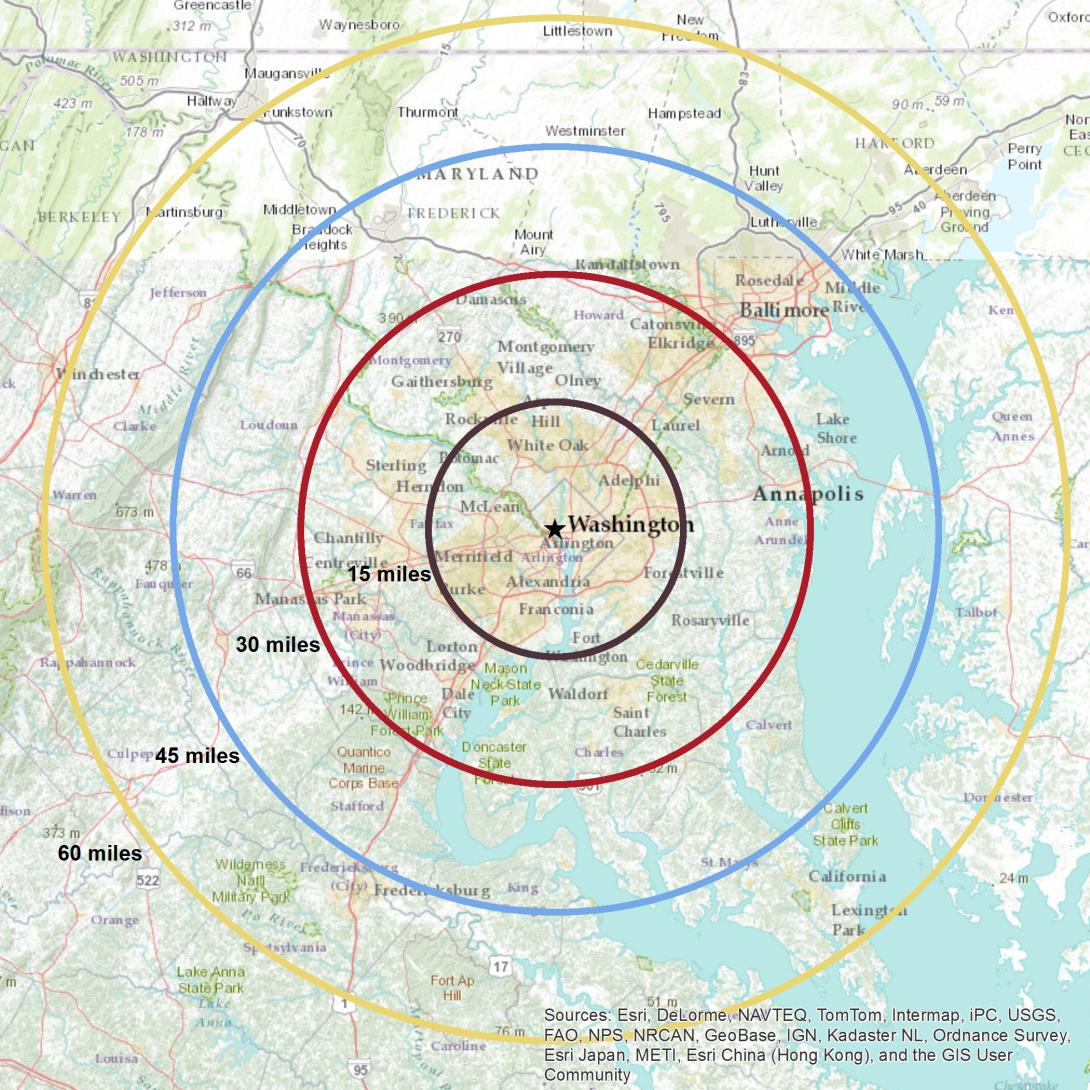
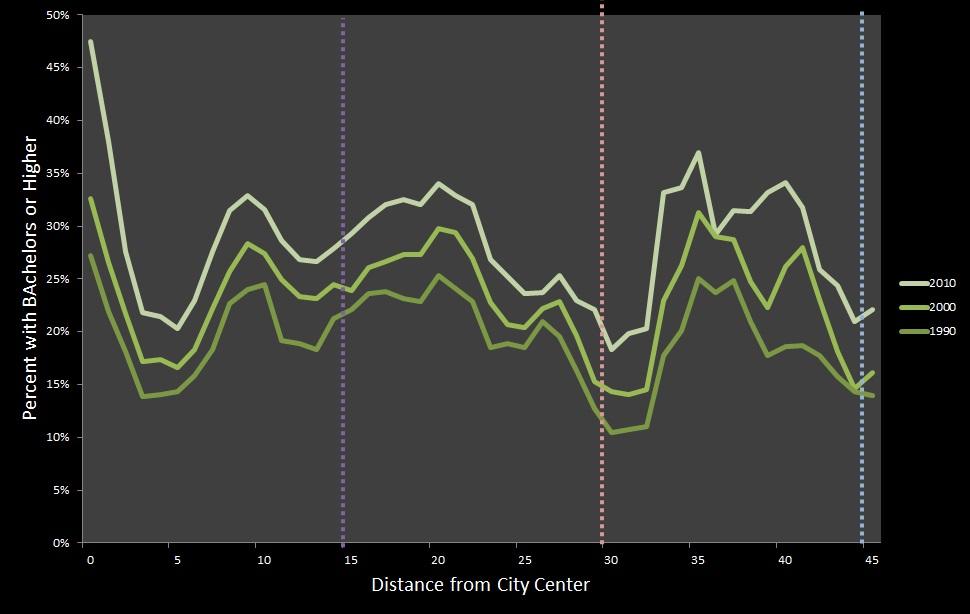
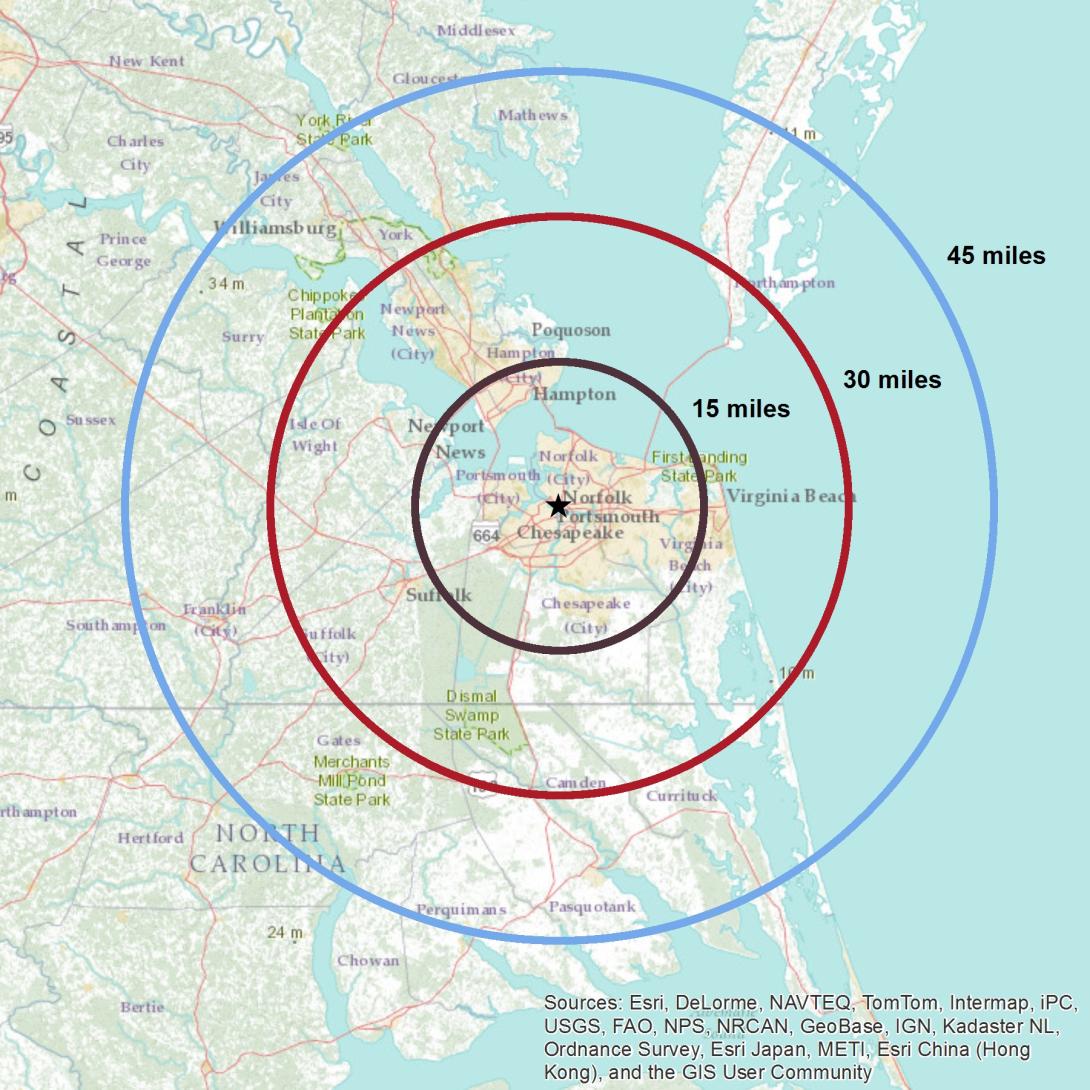
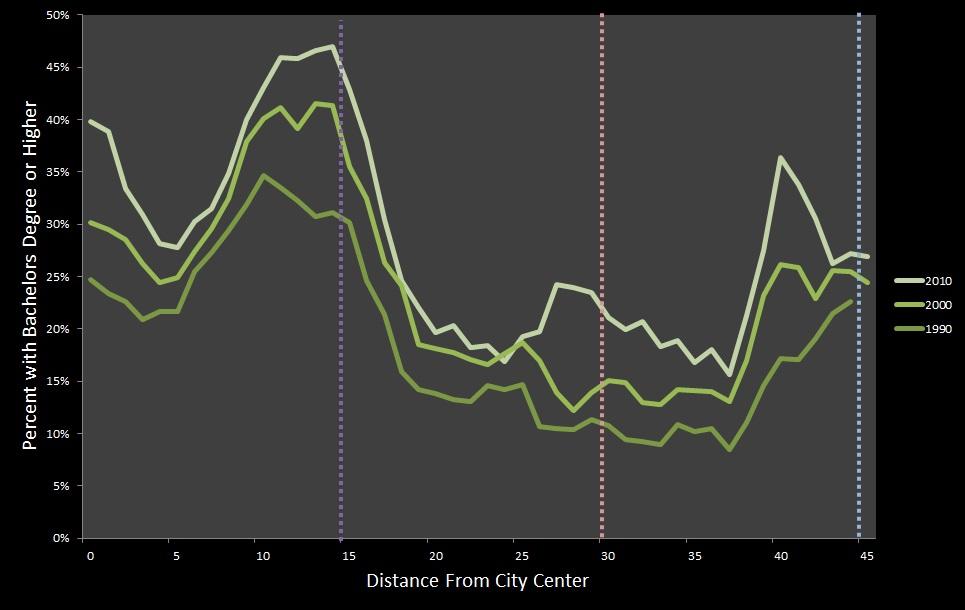
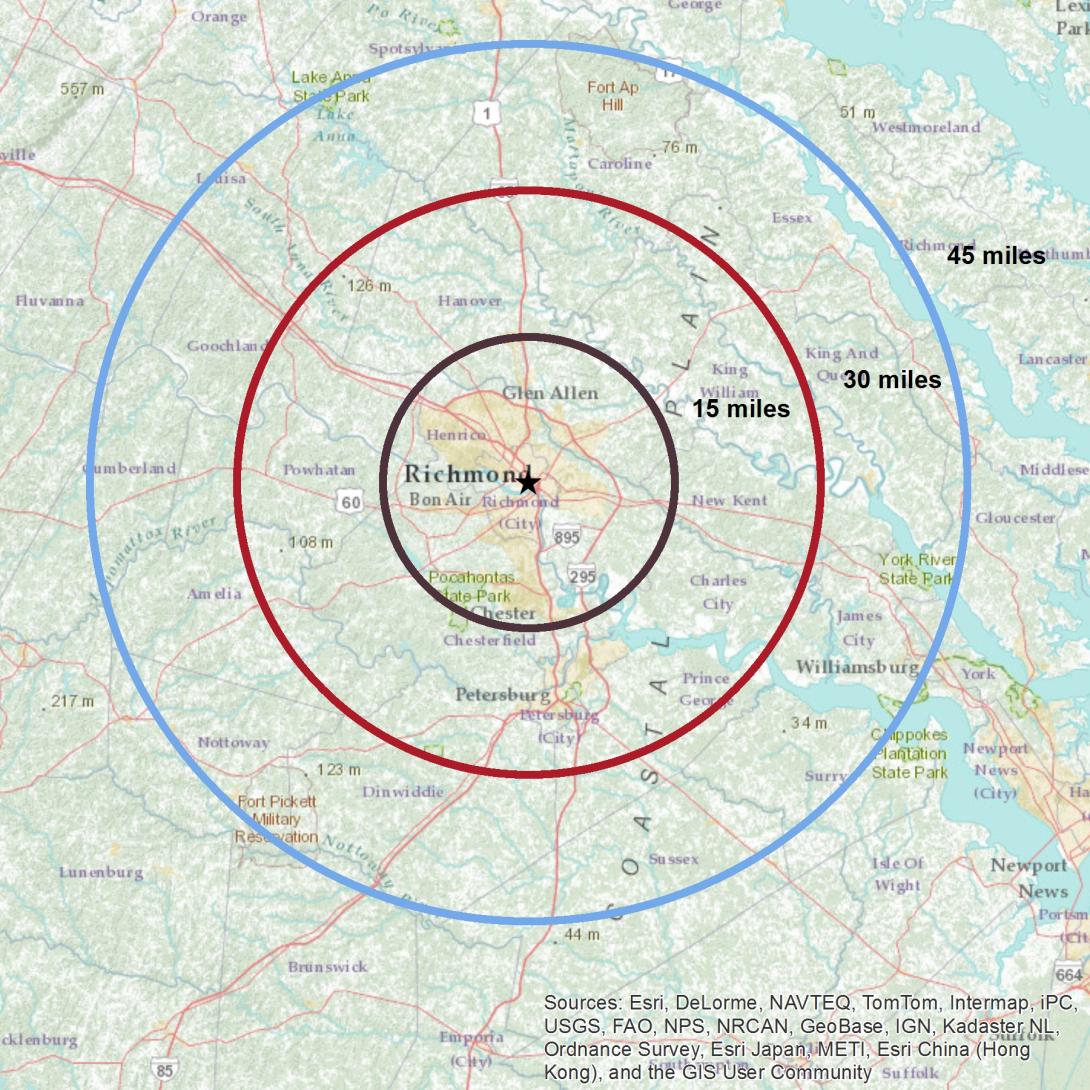
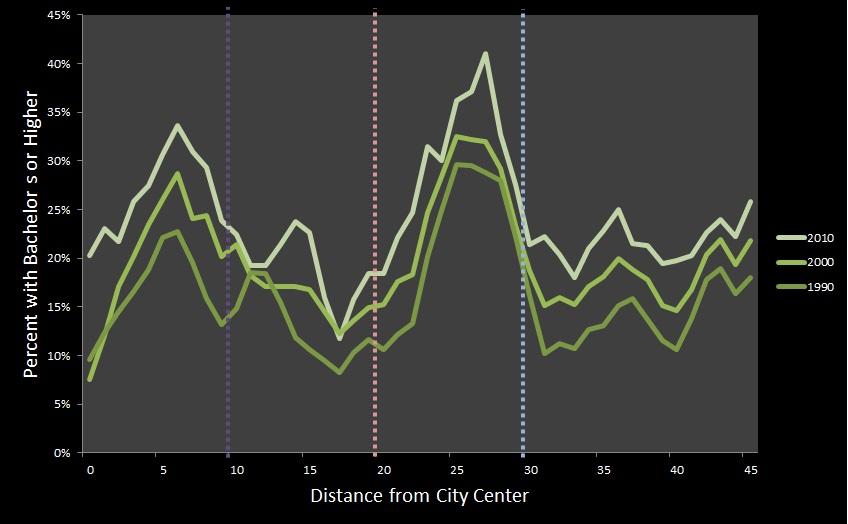
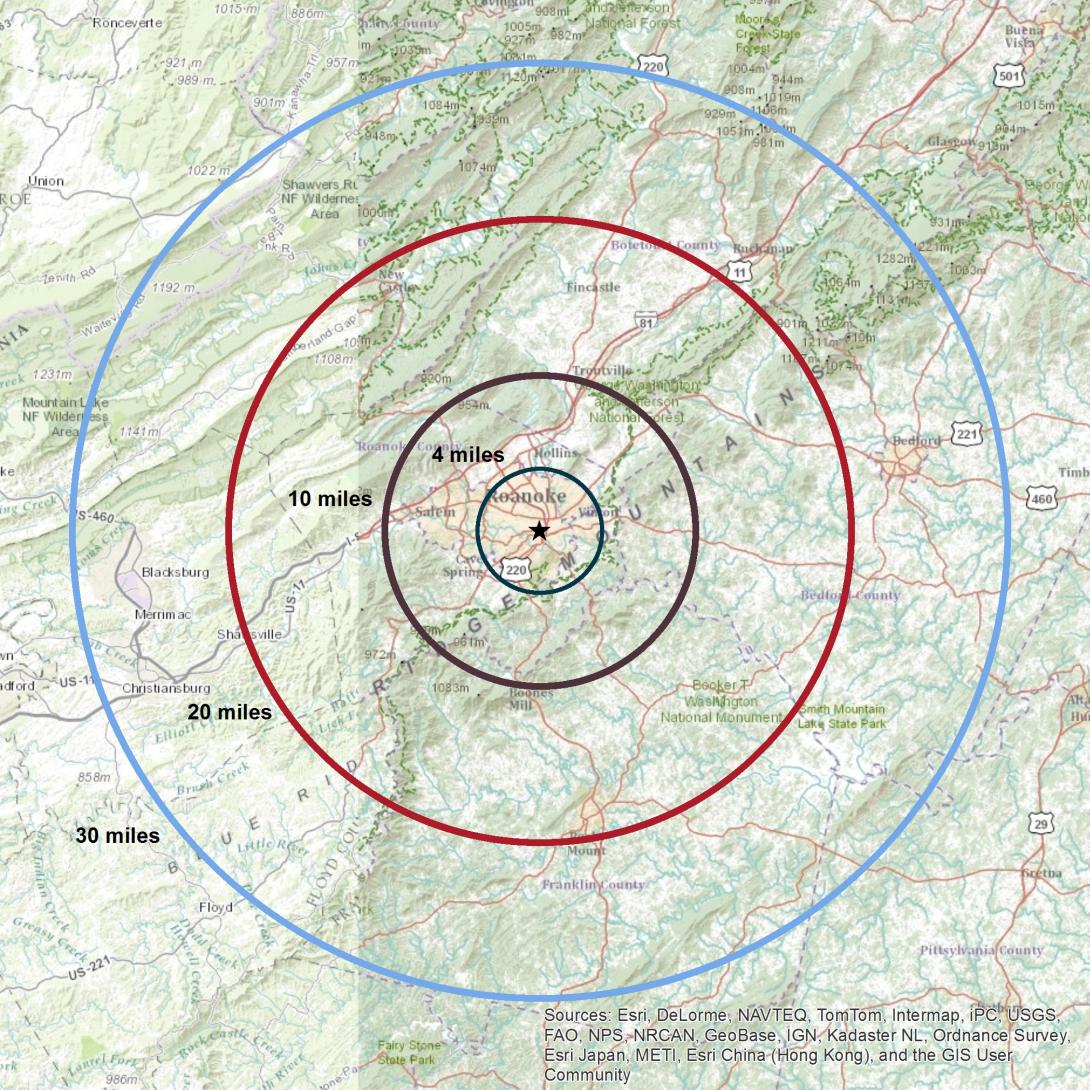
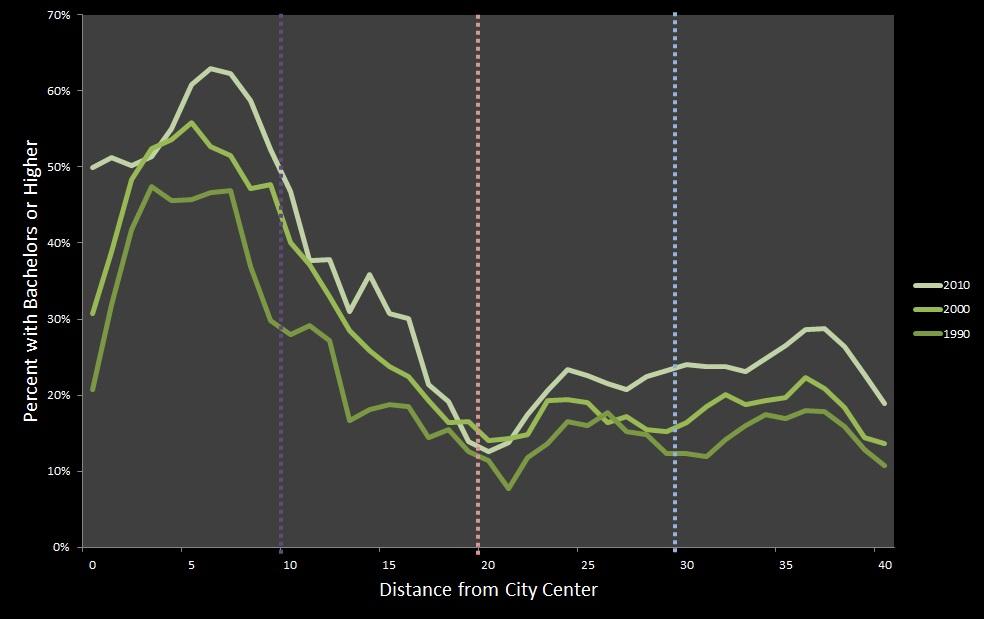
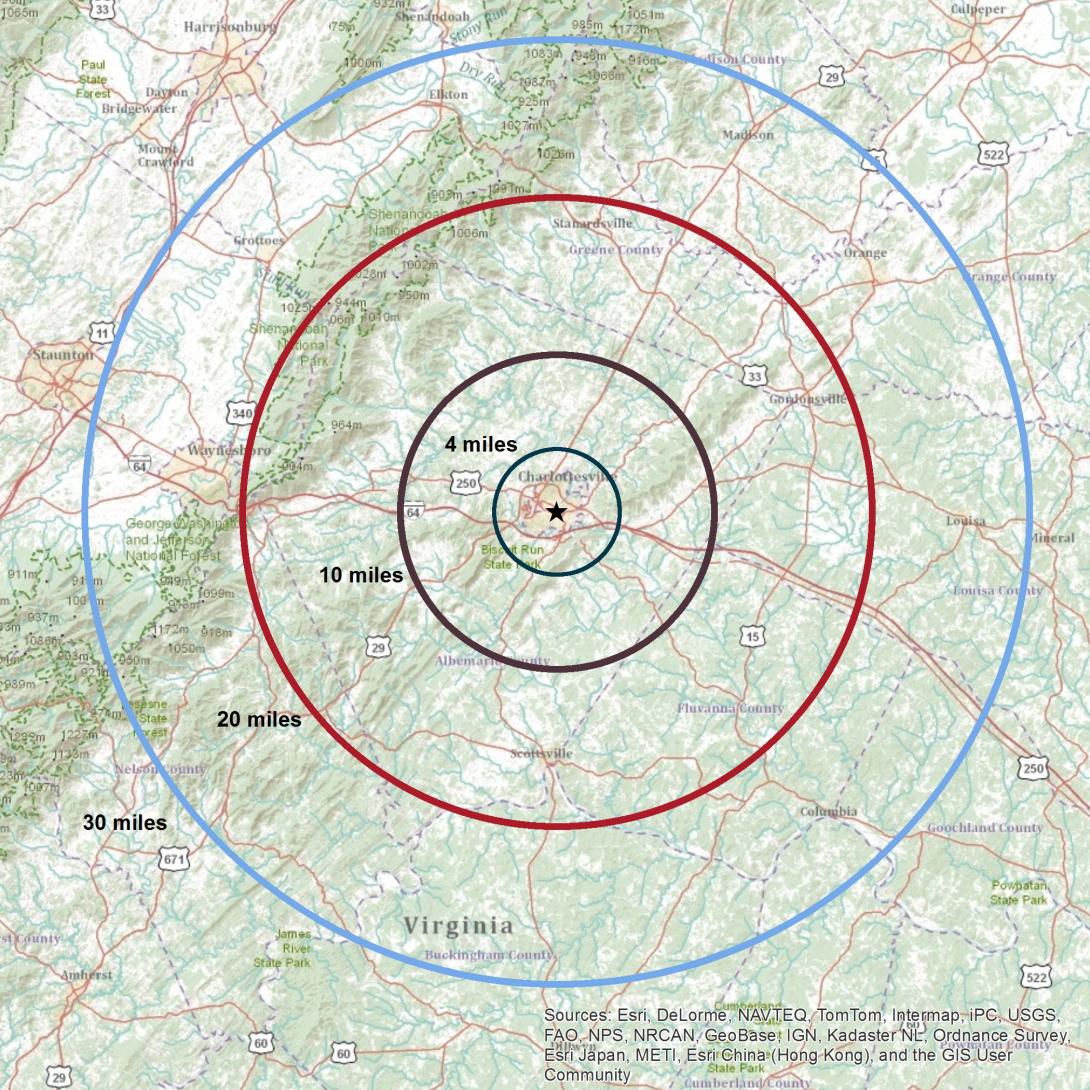
With input from Hamilton, I’ve been looking recently at how metropolitan areas change as one travels from the center to the periphery. The following charts show the percent of the population 25 and older with bachelor’s degrees. The graphs are based on concentric rings coming out from the center of downtown. I’ve included reference maps with distances and put lines on the graphs to correspond to the circles on the map.
It’s important to note that this is for adults who are 25 and older. While college towns have high numbers of educated residents and that shows up on the graphs, these numbers do not include actual undergraduate students or recent graduates.
Data for 1990 and 2000 comes from the long-form census. Data for 2012 is from the American Community Survey’s 2008-2012 5-year estimates. The census long form survey disappeared after the 2000 census, so questions that would have been on the long form (like education level) are now collected as part of the American Community Survey.
Washington, D.C.
Hampton Roads
Choosing a “city center” in Hampton Roads is obviously difficult. I used the area’s historic core in downtown Norfolk, which also sits at the height of the area’s density gradient (I’ll post a graph of that sometime in the near future). But the polycentricity of the area is easy to see.
Richmond
Roanoke
Roanoke has the lowest rates of educational attainment of these metro areas, but has seen a rapid rise in the City of Roanoke itself. Blacksburg shows up as a spike around mile 25.
Charlottesville
Charlottesville has very high levels of educational attainment in the city. It is also such a compact urban area that most of the population is within the 4-mile circle, making this chart a little imprecise.
Thoughts on These Graphs
Charting the percentage of adults with bachelor’s degrees is an interesting proxy for studying neighborhood change (aka gentrification). Socioeconomic class can sometimes show up in education levels where it might not show up in income, since younger white collar workers may not start out making as much money as more established blue collar workers. While the experience varies in each metro area, all five seem to show some significant rise in education levels in the center. Overall education levels in metro areas have been rising steadily as well, largely thanks to the increasing number of college graduates in the U.S.


