


How Virginians get to work
For many of us, the morning commute is often not the best part of the day; however some may actually enjoy this time, managing to find peace and productivity during the trip into their workplace. Countless articles discuss the impact of commuting on the average person’s quality of life, with the costs – time lost in transit, stress from the daily commute, financial expenses – usually outweighing the benefits. People sometimes do not realize how much their commute is costing them, how their overall health and wellness is affected, or how it may be correlated with unhappiness and dissatisfaction.
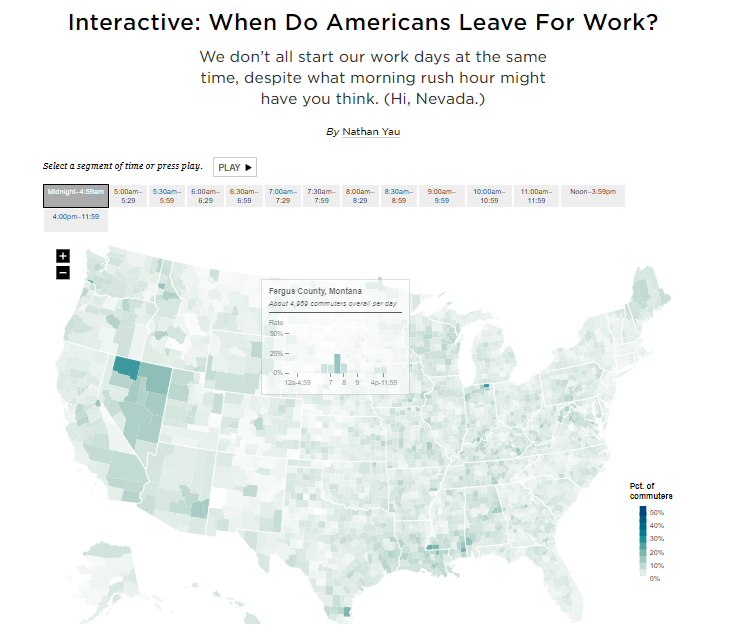
A recent set of county level interactive maps re-visits the issue. The one on “When Do Americans Leave For Work?” (above) tracks when people start their work day across different parts of the country. As the author mentions, it is fun to see the map play out over the 24-hour timeline. Most commuters leave home between 7.00am-8.00am, but Humboldt, Nevada and Lagrange, Indiana stand out with majority of their residents traveling between midnight and 5.00am. Aleutians East Borough, Alaska is also an outlier where many people leave for work later in the day, between 4.00pm and midnight. Another interactive on “How Americans Get to Work” shows the most common mode of transport. As expected, driving alone is the dominant method for majority of the counties, while more workers use public transportation in New York (58%) and Washington D.C. (38%). My favorite is the map of “Average Commute Times” (on the left) which shows the average travel time to work for each zip-code.
Commuting is a complex system with several interacting elements: time of leaving home to go to work, locations of residence and work, means of transport, occupation and industry of employment, class of worker, age, travel time, rent, distance from amenities – to name a few. While these maps are very well executed, I was hoping to better understand the story behind the working American’s daily commute by examining causal linkages between when people leave for work and how long they travel, along with additional variables like the type of job or how far the actual distance traveled is. Given the current data-set, establishing clear causation turned out to be a bit of a challenge, but understanding the hierarchy of the data in itself can often help us see the parallel decisions we make and actions we take related to commuting. I constructed the example below using data from the American Community Survey 2009-2013 for Virginia.
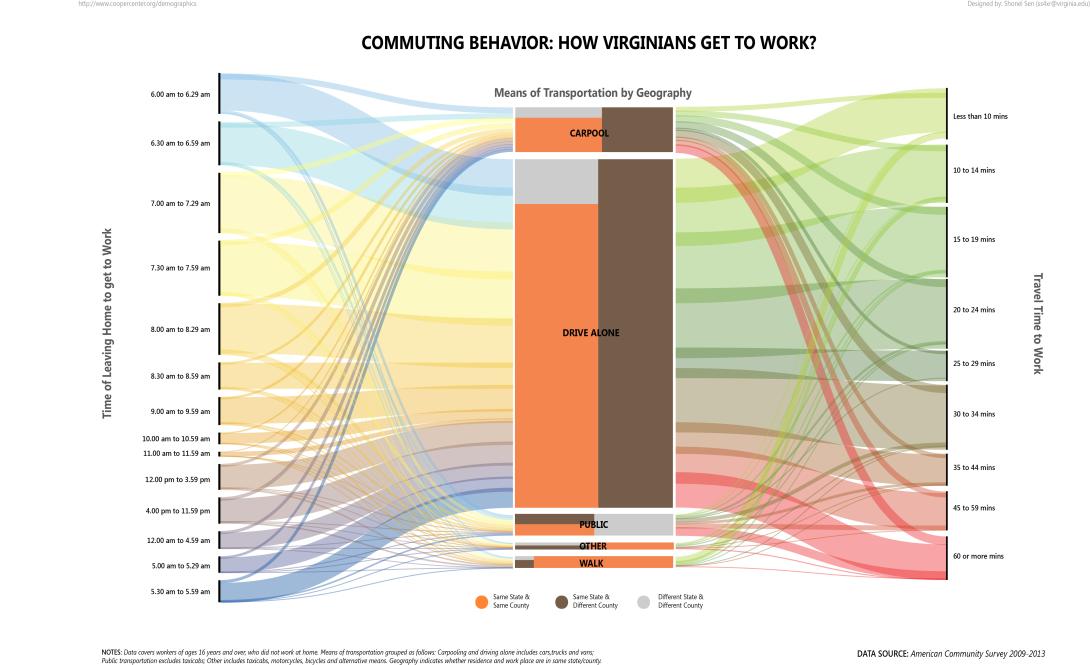
The graphic can be read from either side or center-outwards and all the pathways are scaled to represent the percentage share of the populationi. The middle panel covers the means of transportation (driving alone or carpooling in cars, trucks and vans; public transportation excluding taxis; walking; taxicabs, motorcycles, bicycles and other means) which are split into the shares of people according to their place of residence and work (orange for same state and county; grey for different states and counties; brown for same state but separate counties). The left side represents the time when people leave home to get to work, and the colors range from blue to yellow approximately according to the hours of sunlight. The right side traces the amount of time spent traveling, with low times indicated by green and as the time exceeds half-an-hour, we enter the red zone.
Nearly 10% of Virginians live and work in different states and regularly commute across the state line. Unsurprisingly, driving alone is the most common mode of transport (81%) and peak travel occurs between 7.00am-8.30am. The distribution of travel time is fairly even across the intervals; there are several people who carpool and some who walk for over 60 minutes. Among workers who drive alone, the largest groups are people who leave home between 7.00am-8.00am, and those who spend 15 to 25 minutes traveling. For people who carpool, most tend to leave earlier in the day and have longer commutes. Overall, less than 5% prefer public transport and only 2.5% walk to work. Finally, all of this is for one-way travel (in-bound), so the round trip requires double the amount of time on every workday.
If you are above 16, in Virginia, and working (not from home), you may find yourself represented on the graphic above – start from the left and track your pathway as you leave home via your chosen mode of transportation which will lead you to the amount of time it takes for your everyday commute into work. Next, I am looking forward to exploring how the industry and occupation of the worker may affect the time when they report to work.
_________________________________
NOTES:
i Since the universe for the datasets (ACS 2009-2013) is ‘all workers above 16 years of age who did not work from home’, so all shares are a percentage of this sub-population.