Diversity among Asians in Virginia
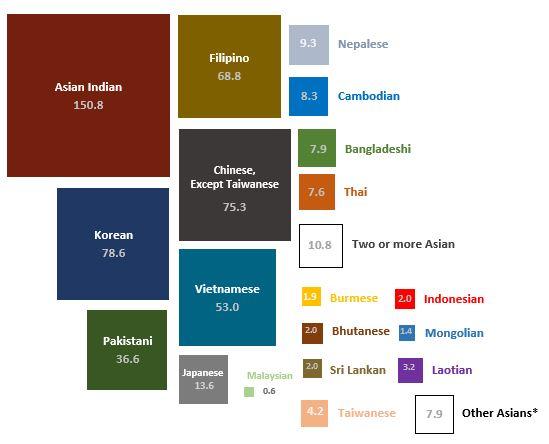
I recently wrote a post about how Asians in Virginia are often stereotyped as a successful minority due to their high median household income and their significant share of employment in STEM-related occupations. Despite being collectively identified as “Asians,” the Asian population is heterogeneous, comprised of more than thirty different nationalities and ethnic groups. The following graph illustrates the diversity among the over 545,000 members of Virginia’s Asian population. Asian Indians (28%), Koreans (14%), Chinese (14%), Filipinos (13%), and Vietnamese (10%) make up the most significant portions of this population.

Source: U.S. Census Bureau, 2017 American Community Survey 1-Year Estimates
Nearly 70 percent of Asians in Virginia are foreign-born, coming to the United States for a range of different reasons – to pursue educational and professional opportunities, to reunite with their families, and to escape persecution, war, and violence in their home countries. As a result, socioeconomic conditions – especially income and educational attainment – differ noticeably across these Asian populations.
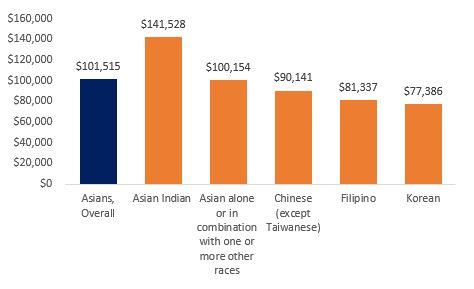
First, let’s take a look at the differences in median household income. The following graph compares the 2017 median household incomes of the largest Asian subgroups in Virginia. Due to sample size limitations, only the largest groups can be compared. Even though median household incomes of these Asian groups are not starkly different, this graph shows that disparity does exist. Households headed by Asian Indians have the most substantial median household income, which is $64,142 greater than the median income of Korean households.

Source: U.S. Census Bureau, 2017 American Community Survey 1-Year Estimates
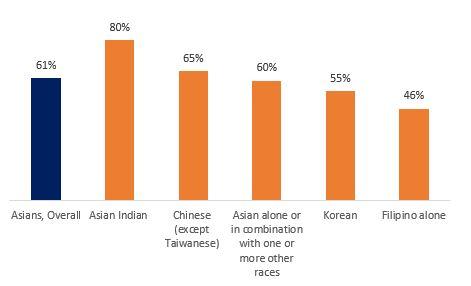
As the graph below demonstrates, the income disparity among these groups may be a reflection of differences in educational attainment among them. In Virginia in 2017, 80 percent of Asian Indians ages 25 and older held a bachelor’s degree or higher, compared to 65 percent of Chinese Asians, 55 percent of Korean Asians, and 46 percent of Filipino Asians.

Source: U.S. Census Bureau, 2017 American Community Survey 1-Year Estimates
Higher academic achievement among Asian Indians and Chinese Asians most likely results in their more substantial share of employment in high-paying STEM occupations. For example, 37 percent of Asian Indians and 29 percent of Chinese Asians in Virginia work in these types of occupations– compared to just 23 percent of Asians overall.
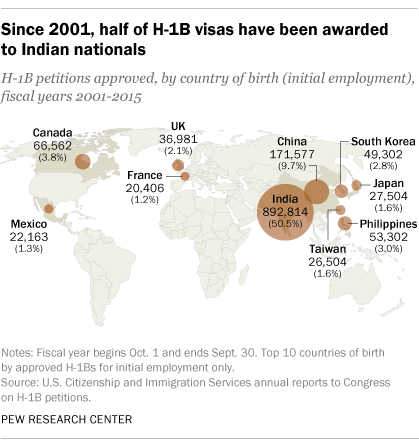
Virginia, especially Northern Virginia, attracted many Asian immigrants seeking STEM careers with H1B visas in the 1990s. An H1B visa is a visa which permits U.S. employers to temporarily employ foreign workers in specialized occupations. It was created by the Immigration and Nationality Act of 1990. The total number of H-1B visas that are issued each year throughout the United States is limited by law. The annual cap for H1B visas was the highest between 2001 and 2003, with 195,000 spots available each year, compared to just 65,000 spots per year in the 1990s. The Pew Research Center found that Indian nationals received half of all H1B visas granted in the United States from 2001 to 2015.

Source: Pew Research Center
Washington-Arlington-Alexandria is one of the top metropolitan areas in the United States in terms of the total number of H1B visas approved. As shown in the graph below, 34 percent of Asian Indians currently living in Virginia entered the U.S. between 2001 and 2009, a significantly higher percentage than other Asian nationalities. This suggests that Asian Indians moved to Virginia to pursue high-paying STEM jobs and may explain their higher levels of median household income and educational attainment compared to other Asian subpopulations in Virginia.

Source: U.S. Census Bureau, 2017 American Community Survey 1-Year Estimate
In summary, the foreign-born Asian population in Virginia is diverse and consists of permanent residents, temporary workers, and humanitarian migrants. While certain Asian groups have higher shares of their populations holding high-level academic degrees, other Asian groups–especially those fleeing their home countries because of violence and persecution–have higher proportions holding less than a high-school diploma. Among the latter groups, median household incomes are generally much lower.
Unfortunately, the small sample size of these Asian groups often does not generate sufficient data for comparison. Indeed, more comprehensive socioeconomic studies are necessary to fully understand the income disparity among various Asian nationalities and ethnicities in Virginia.


