Comparing 2020 Virginia Population Projections to the Census Count

Population projections provide an approximate idea of the expected future population size and are used in urban planning, resource allocation for emergency services, prioritizing public and private investments, and in many other ways. By using past observations with present trends and making certain plausible assumptions, we built the official 2020 projected population for each of Virginia’s 133 cities and counties.
Even though the future is largely unknown and unpredictable, at the start of each decade, we get a chance to compare the accuracy of our projections with the U.S. Decennial Census data. This allows us to ensure that our projection methods are guided by rigorous demographic and statistical standards, and produce reasonable numbers at both the locality and state levels when carefully tested against Census data.
Given Virginia’s large number of counties and county-equivalent cities—with population sizes ranging from 1,150,309 in Fairfax County to 2,232 people in Highland—we used projection methodologies with statewide applicability that are both theoretically sound and also capable of providing detailed breakdowns at the locality level.

According to empirical findings1, for a 10-year projection, the typical county-level average error is 12, and our evaluations yielded an average error of 2.33, which is well within the acceptable range. Overall, our projections were higher than the actual counts in 66 localities, and lower for 67 cities and counties, indicating well-balanced results. Grouping Virginia’s 95 counties and 38 independent cities by population size and comparing the results to the Census counts (see Figure 1 below) reveals that our projections were the least accurate for Radford city (over by 14.8%) and Prince George County (under by 12.5%), while Lancaster County’s expected population most closely matched the Census count. In terms of actual population totals, the greatest divergence from Census counts occurred in Fairfax County, which we over-projected by 12,195 people and Chesterfield County which we under-projected by 10,707 residents (representing a 1.1% and -2.9% divergence, respectively).

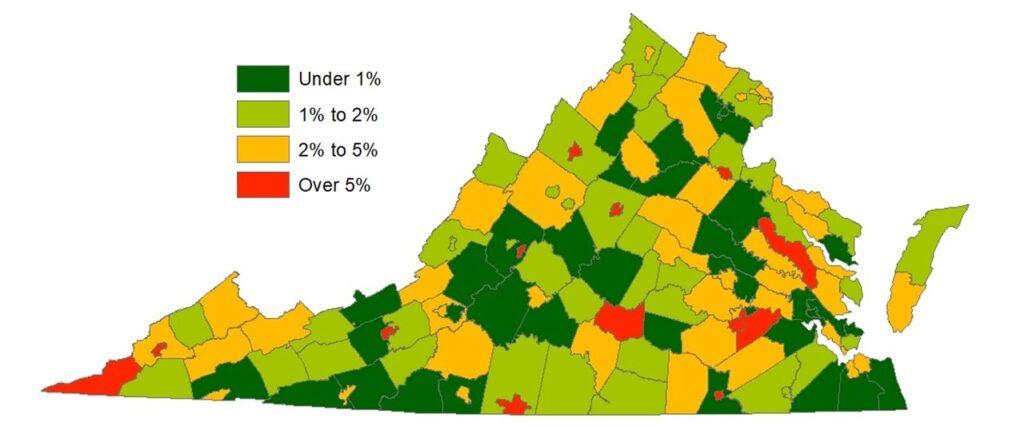
Despite Virginia’s diverse range of cities and counties, our projections performed well. The map in Figure 2, shows that
- 120 localities were projected within +/-5% range of the actual Census count (41 localities were within 1%; 35 cases were within 1% and 2%; and 44 cases were projected between the 2% and 5% margin).
- Of the remaining 13 localities (in red), 11 were projected within 5% and 10% error margin (including Charlottesville city at 8.9% and Harrisonburg city at 8.1%), and the 2 main outliers beyond 10% are Radford city and Prince George County. This could be partly explained by the presence of group quarters. For instance Charlottesville, Harrisonburg, and Radford are all college towns, and students living in off-campus housing may have been undercounted.

Overall, the 2020 Virginia projection results were highly accurate: statewide the projected population total was only 0.27% higher than the actual Census count, and over 90% of the localities were projected within 5% range of the decennial headcount2. In addition, our last round of projections indicated that the pace of growth would slow down and the rural-urban divide would become more prominent, which has been confirmed through the evaluation of our projections compared to Census counts.
Testing the accuracy of population projections is critical as it validates our findings and the strength of our methodology. It also demonstrates to data users in various sectors (governments, businesses, non-profits etc.) that this data and research is credible and can be reliably used for their individual needs and applications. Using the 2020 Census and data from previous decades, we plan to develop and release the 2030, 2040, and 2050 projections in July 2022.
Footnotes:
1: Stanley K. Smith, Jeff Tayman, and David A. Swanson. 2001. State and Local Population Projections: Methodology and Analysis. New York: Kluwer Academic/Plenum Publishers.
2: Some of our college town projections may appear a bit off, which may be due, in part, to the group quarters data collection issues reflected in the Census numbers.


