


What is the biggest demographic trend in Virginia?
Every year the Demographics Research Group is asked to give presentations on Virginia’s demographic trends, and this year, as is true every year, the demographic trends we explored depended on our audience’s area of interest—school enrollment change for the Board of Education, population growth trends for the House Appropriations Committee, or population projections for the Virginia Planning Association. However, behind all of these trends, there was one significant driving factor: aging. The aging of Baby Boomers is not only swelling the 65+ population, but is also having a ripple effect across all age groups, slowing growth in the working-age population and often causing decline in the school-age population.
The growth in Virginia’s population over age 65 is a widely known trend and is commonly recognized as the most significant demographic change currently taking place across the U.S. But the expected rate of growth in the 65+ population is still stunning. In just 20 years (between 2010 and 2030), Virginia’s population age 65 and older is expected to jump from 976,937 to 1,803,404, contributing to the majority of Virginia’s population growth during the period. Outside of Northern Virginia, 85 percent of the projected population growth is predicted to come from those 65 and older. Benjamin Franklin famously said “in this world nothing can be said to be certain, except death and taxes.” Barring a catastrophic spike in deaths, the aging of Virginia’s population is also a certainty.
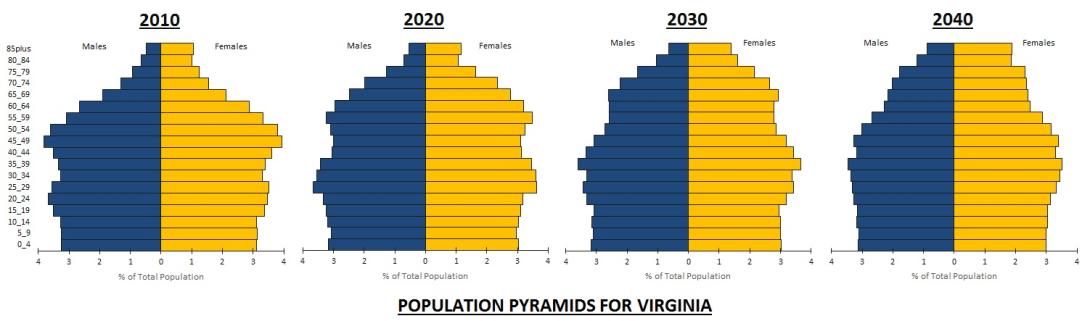
The reason why growth in Virginia’s 65+ population is happening so quickly is that the generation born prior to the Baby Boomers, who currently make up most of Virginia’s older population, is considerably smaller than the Baby Boomer generation. The number of births in the U.S. during much of the 1930s (prior to the Baby Boomers) was half that of births during the late 1950s (Baby Boomers). So as the tens of millions of Baby Boomers born after the Second World War continue to age, they are swelling the 65+ population.
What goes up must come down
If Virginia’s age groups were evenly distributed, the impact of the aging Baby Boomers would only be seen in growth of the 65+ population. But the generation born after the Baby Boomers, now between their late 30s and early 50s, is also considerably smaller, causing the number of Virginia’s 50- year-olds to decline as Baby Boomers age out of their 50s. Fortunately, on the state level, there are just enough people turning 20 to keep the total working-age population from declining.
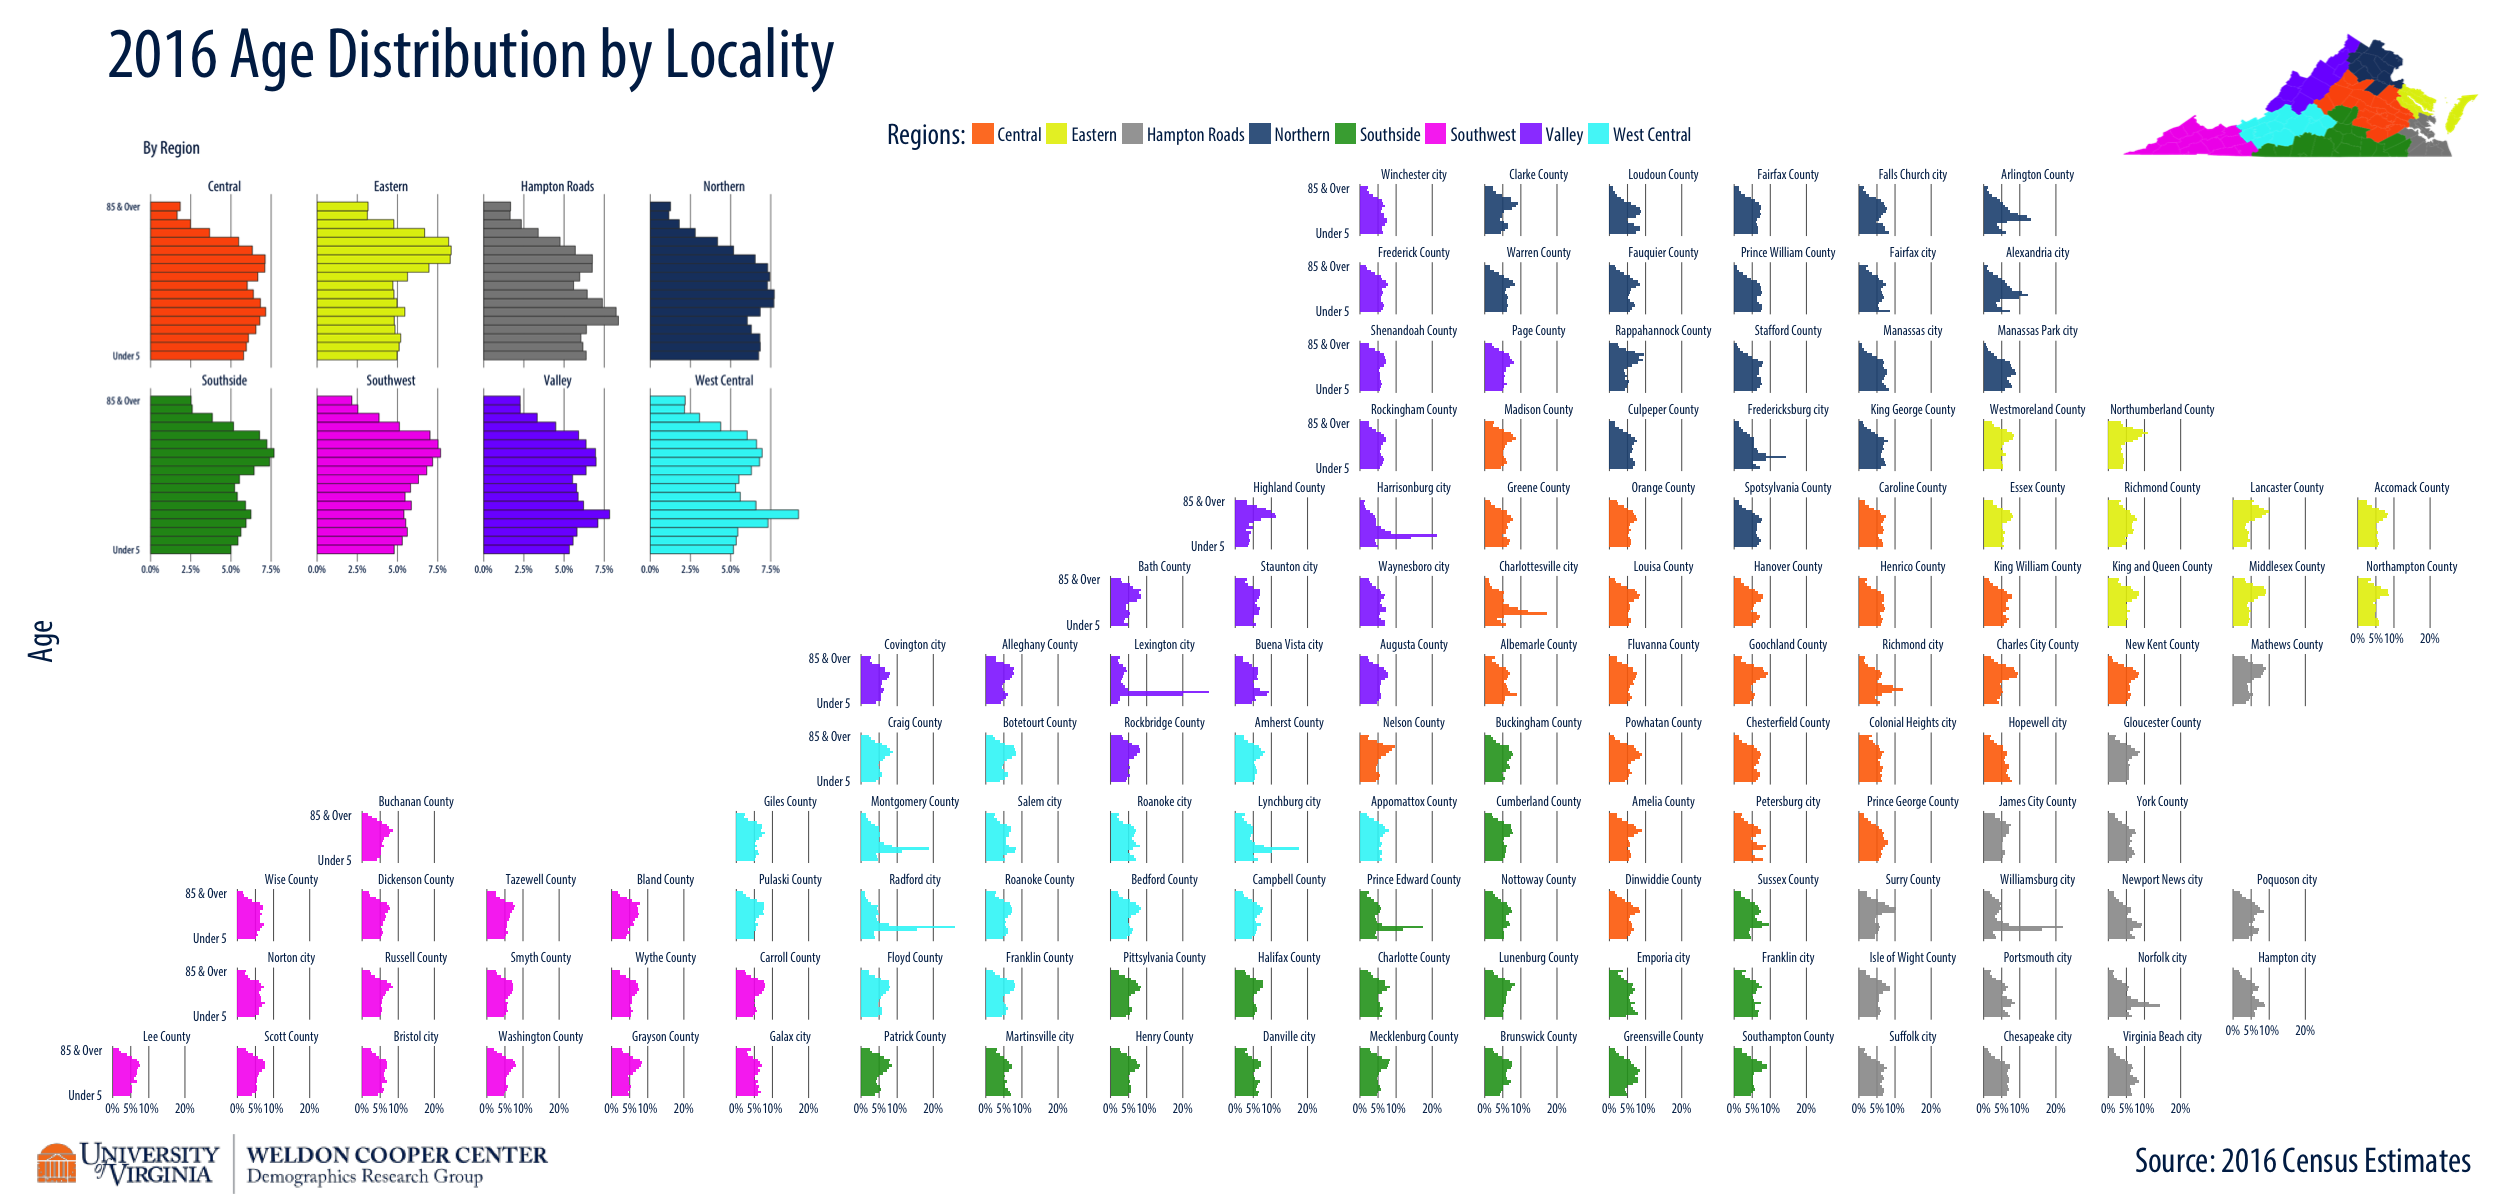
As the chart below shows, the age structure in most of Virginia’s regions and communities is much less proportionate. Decades of young adults moving away and older adults moving in has created a top-heavy age structure in most of Virginia’s counties and cities, with few residents in their 20s and 30s and many in their 50s and 60s. Now that many of their residents are aging out of the workforce, the working -age population in most Virginia and the U.S. counties has begun to decline.
Charles City County, located 10 miles outside of Richmond, is a good example of how aging is transforming the entire demographics of most Virginia communities. The population of Charles City County is projected to grow about 5 percent by 2030, but Charles City County’s age distribution will undergo a transformation during the same period. Like Virginia overall, Charles City County’s 65+ population is expected to nearly double by 2030 and as this large population of Baby Boomers age out of the workforce, Charles City’s working-age population is expected to shrink.
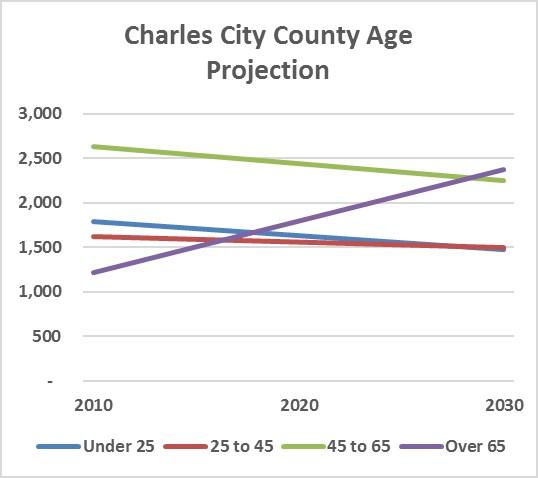
If the working-age population declines, typically there will be fewer families and, as a result, fewer children and young adults. Charles City County’s population under age 25 is projected to be 17 percent smaller in 2030 than it was in 2010. However, at this point, the 2030 projection appears conservative: its K-12 student enrollment has already declined by 24 percent since 2010. But Charles City County isn’t alone: Among Virginia’s 95 counties, K-12 student enrollment has declined in 70 counties since 2010.
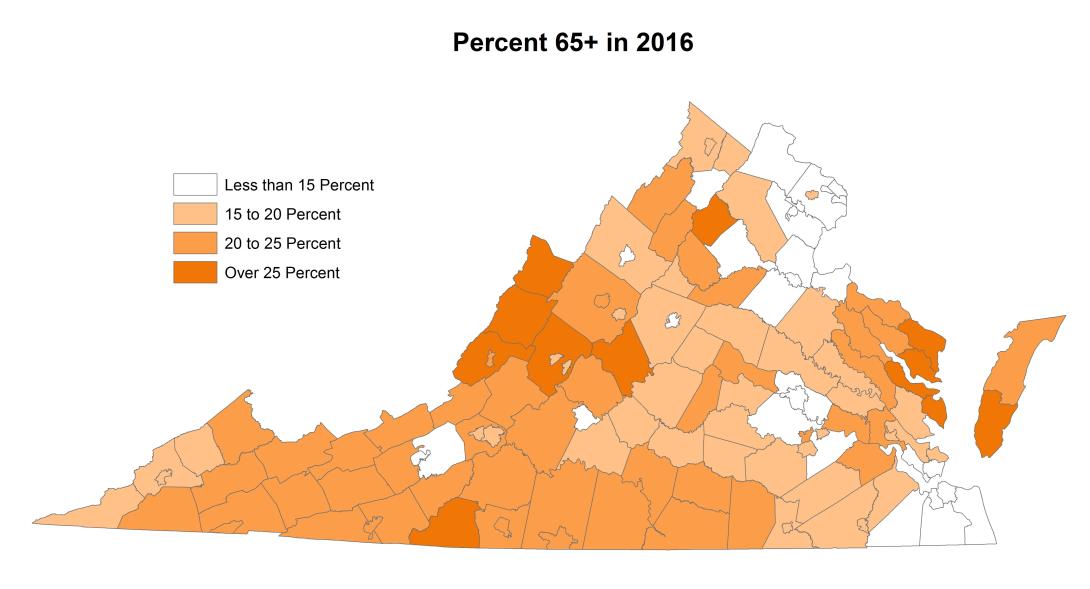
Cities are commonly seen as the incubators of most trends that will eventually trickle down to the rest of society. But when it comes to what might be the biggest demographic trend in Virginia, cities are hardly at the vanguard of aging. Instead, many rural counties, such as Charles City, already look like Virginia will in 2030 (with 1 in 5 residents over 65). How well these communities have adapted to the transformation of their populations may be the best indicator of how Virginia will fare in the coming decade.