Ancestry: Who do you think you are?
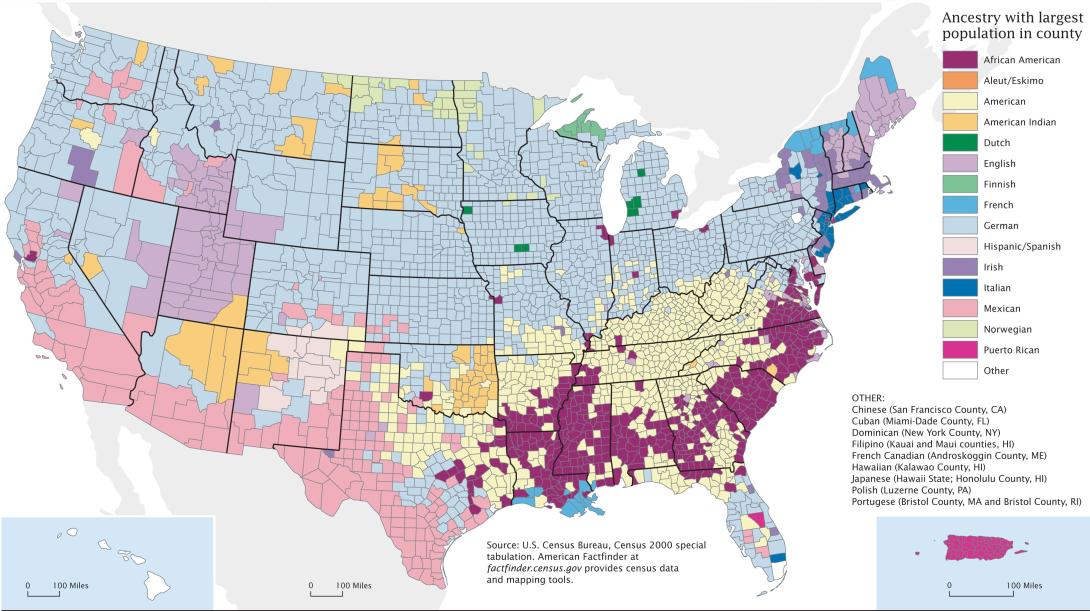
This is one of my favorite demographic maps. It was produced by the Census Bureau to show the most commonly reported ancestry for each county in the United States in 2000. Even though the data is over 13 years old, the map remains very popular.

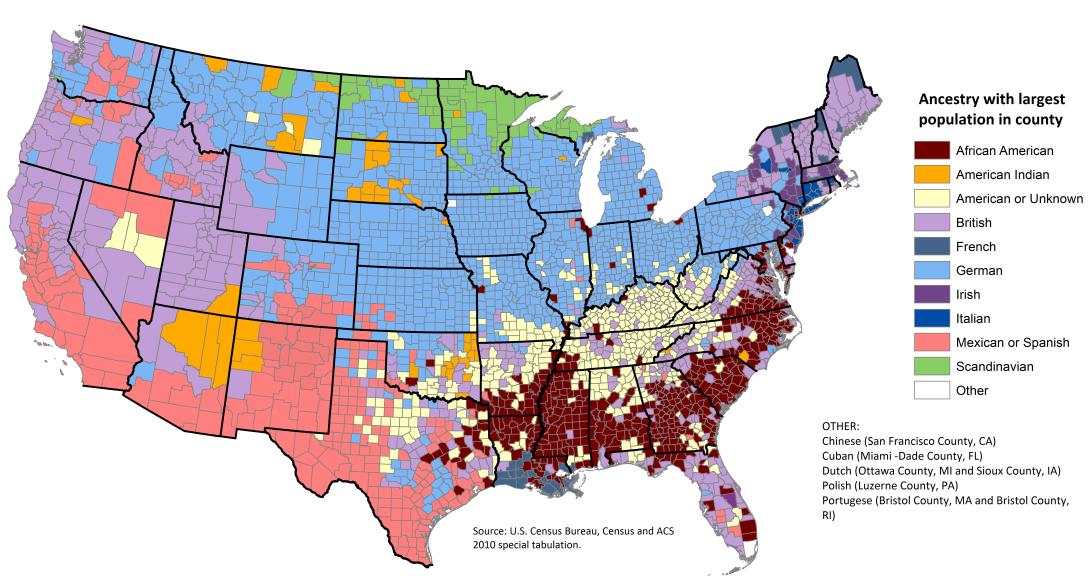
Since a follow-up map for 2010 has not been produced yet, I thought it would be more than worthwhile to create this map using Census American Community Survey data.

The methodologies used in making the 2000 and 2010 ancestry maps are similar, but there is one important alteration in the 2010 map. Ancestries that can be logically grouped together were combined so they might be better represented on the map. For example, Scandinavian ancestries: Norwegian, Danish, Swedish and Finnish, are very common in the Upper Midwest. Individually, they are the most popular ancestries in only a few counties, but when grouped together, Scandinavian is the most common ancestry in over 70 Upper Midwest counties.

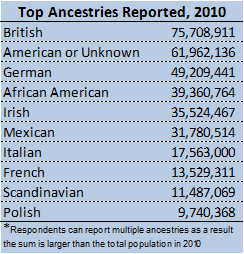
On the 2010 map, German appears to be the most common ancestry in the U.S, but German is actually the third most reported ancestry since people reporting German ancestry are largely concentrated in the Midwest and Plains states. British and American or Unknown are the top two reported ancestries because they are common throughout the country, particularly in states with large populations, such as New York, Florida, Texas and California.
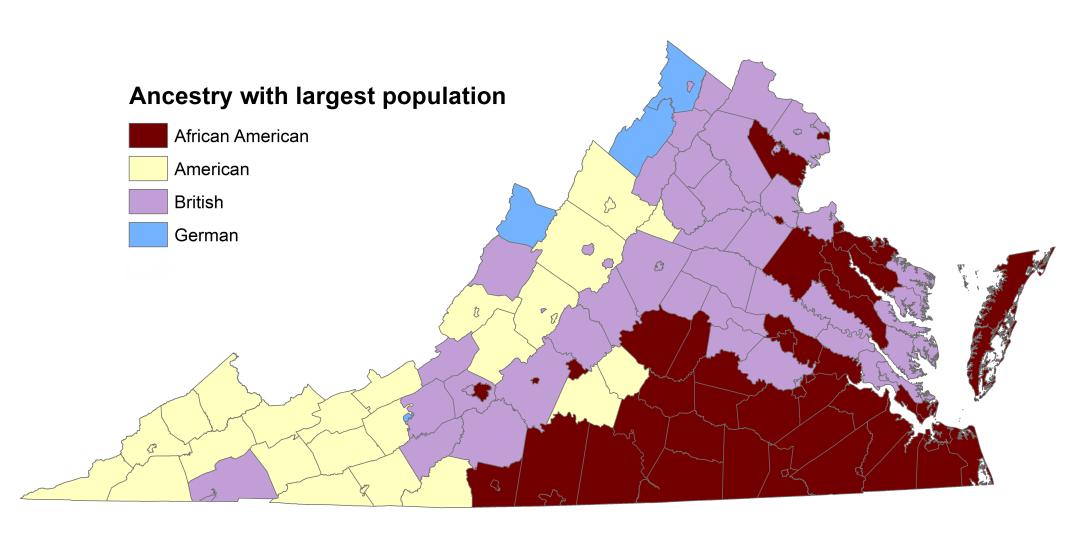
Zooming in to Virginia, most counties east of the Blue Ridge reported British as the most common ancestry in the north and African American as the most common ancestry in the south, roughly following historical settlement patterns. West of the Blue Ridge, German was the most common ancestry in counties that were settled by German migrants from Pennsylvania, and American was the most common ancestry where Scotch-Irish settlers predominated.

The popularity of genealogy TV shows (Family Tree, Finding You Roots, Genealogy Roadshow, etc.) indicates a widespread interest in tracing ancestry. But one lesson you can take from the shows collectively is how little people know about their ancestry. Because the number of ancestors doubles in each preceding generation, most people begin to lose track of ancestors within a couple generations. If you tried to trace back your ancestors over the last 250 years, you would have to track down several thousand 8th great-grandparents.
The Census Bureau’s survey on ancestry also indicates that many people realize they don’t know exactly what their ancestry is. With close to a 1,000 options for entering their ancestry, including Walloon or perhaps Lombardian, 20 percent reported their ancestry was Unknown or American. Similarly, the number of people reporting English as an ancestry in Census surveys dropped from 50 million in 1980 to under 25 million in 2000, before inexplicably increasing again to 27 million in 2010.
Despite the difficulties in tracing back ancestry, Census ancestry data does at least show who we think we are. Maybe that is just as informative as who we actually are.


