


What, exactly, do Americans do all day?
Last week, the Bureau of Labor Statistics released results from the 2013 American Time Use Survey. This survey, administered every year for the last decade, asks respondents–selected from people who have recently completed the Current Population Survey–to keep a diary of how they spent their time for a full 24 hour period. These data allow us to understand something about the “average” day not only for the population overall, but also for various subgroups, such as the unemployed or elderly. As you read, consider: How helpful is information about the “average” respondent?
While there is a fair amount of data to mine, let’s start at the highest level, by looking at time use on an “average” weekday across all respondents:
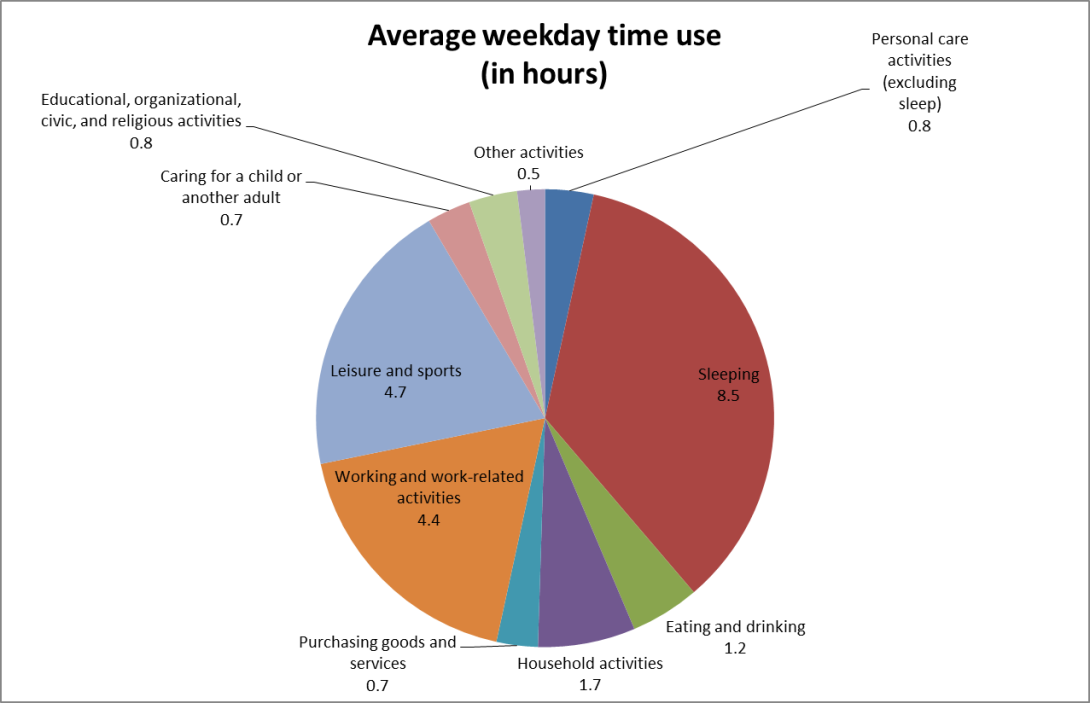
Perhaps most notable is the sheer amount of sleep people seem to be getting: apparently, a healthy 8.5 hours a night. Not bad!
…however. As detailed over at Wonkblog, it turns out that “sleeping” is what happens between getting into bed and getting out of bed, and also takes into account naps. This way of calculating sleep doesn’t differentiate between deep slumber and “dozing off to Netflix” (I know I’m not the only one). Similarly, things like “reading in bed” could feasibly occur during these otherwise allocated sleep hours.
And though 99.9 percent of all respondents reported that they slept at some point in the previous 24 hours, the time reported for other activities is averaged across everyone in the survey, whether they did or did not report them in their time-use “diary”. This is where we need to pay attention to what we mean by “average”.
For example, take a look at “working and work-related activities”. While it may appear that the average American works devotes less time to work than to leisure and sports on any given weekday, it’s important to keep in mind that the reported work hours are averaged out across all respondents– including students, the unemployed, and retirees. Among those who did report any weekday “work or work-related activities” (slightly over half of all respondents) the average amount of time spent was 8.5 hours. And among those who worked full time, the average workday was over 9 hours long.
Other data points of interest:
- While 6.4 percent of respondents participated in religious/spiritual activities on weekdays, 15.5 percent of respondents did so on weekends.
- Nearly 80 percent of all respondents reported watching TV on an average day, weekday or weekend.
- Among married or cohabiting respondents living with children under the age of 18, over one third report that both partners work full-time. In this situation*, women report, on average, 5 hours 12 minutes weekday care for household kids; men report about 3 hours 24 minutes.
- The Weekend Warrior may be a mythical creature: About the same percentage of respondents reported working out–playing sports, running, “climbing, spelunking, caving” or engaging in other fitness activities–whether they were surveyed on weekdays (19 percent) or weekends (18 percent).**
This is a rich and reveling set of data, so I anticipate coming back to it for some Virginia-specific information. For those of you who can’t wait to check out some state-level trends, here is another pass Wonkblog took at the numbers: a set of maps showing state-to-state comparisons for ten different activities. How does Virginia stack up in that analysis? Well, for most of the measures, we’re about…average.
____________________________
*Which may include both different- and same-sex couples
**Yes, the people working out on the weekend may be an entirely different crop than those working out on weekdays, but we’re not seeing the galloping hordes out there.