


Health insurance coverage: Who has it and who doesn’t?
“Healthy citizens are the greatest asset any country can have” is a quote often ascribed to the British PM Sir Winston Churchill. In that spirit, and in light of the recent health care reform debate within the US, I wondered what the current picture of health coverage actually looks like. The Census Bureau offers tools that allow us to see the same data set from different perspectives. Since 2008, the historical face of health insurance has changed significantly as depicted in Change in Health Insurance Map below. The transition starts gradually and until 2013, most states remain in the brackets with lower insurance rates. But over 2014 and 2015, with the exception of Alaska and Texas, the uninsured rate across all states dramatically dropped below 14%.
CHANGE IN HEALTH INSURANCE MAP 2008-2015

The Trends in Health Insurance image below lists the states by their rates of health coverage in 2015. The dots clustering together indicate minor changes up until 2013, but there is a leftward movement overall (including Alaska and Texas) until 2015, mirroring the pattern seen in the map in Fig 1. Massachusetts is the pack leader in terms of states with high insurance rates, while Texas has some catching up to do. Virginia (right next to the red dot representing the US) ranks in the middle order of the list in 2015, with the health insurance rates fluctuating in the intervening years but settling at an eight year high, just above the national average.
TRENDS IN HEALTH INSURANCE 2008-2015

Within Virginia, more than 90% of the overall population has some form of health insurance or coverage, which translates to 7.4 million people. But that still leaves 9.1% of the population without health coverage. The breakdown by age of those Virginian’s without health insurance can be found in the graph below (Health Insurance by Age in Virginia).
HEALTH INSURANCE BY AGE IN VIRGINIA 2015
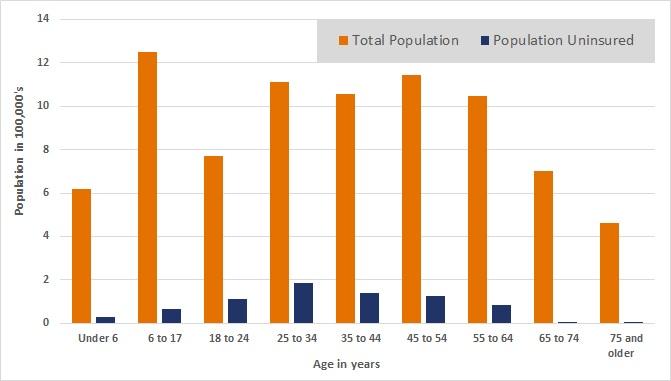
For the state as a whole, 4.9% of those under the age of 18, and 12.6% of people between the ages of 18 and 64 are uninsured. The percentage of those over 65 without health insurance is at 0.9% within this age group, which amounts to nearly 11,000 people. Each of the individual cities and counties across the Commonwealth has its own story to tell.