Birth rates: Comparing Virginia’s counties with countries
One trend that was very noticeable in the recent population estimates for Virginia in 2014 was how much growth has slowed since 2010. While fewer people moving into the state was one cause for the slowdown, the other cause was Virginia’s declining birth rate. It is hard for any population to grow when it does not have enough births to replace deaths, as is the case in much of Virginia.
To illustrate how low birth rates are in much of Virginia, I thought it would useful to overlay a map of county and city birth rates in Virginia with the names of countries which have similar birth rates.
Virginia equivalents
View larger map
Some of the comparisons may not be surprising, the Northern Neck has long been a favorite retirement spot, so one might expect its birth rates to be similar to Japan’s which also has a large older population. But many localities with historically robust populations have birth rates comparable to countries not as well known for vigorous growth, such as Chesapeake with Russia and Hanover with Greece.
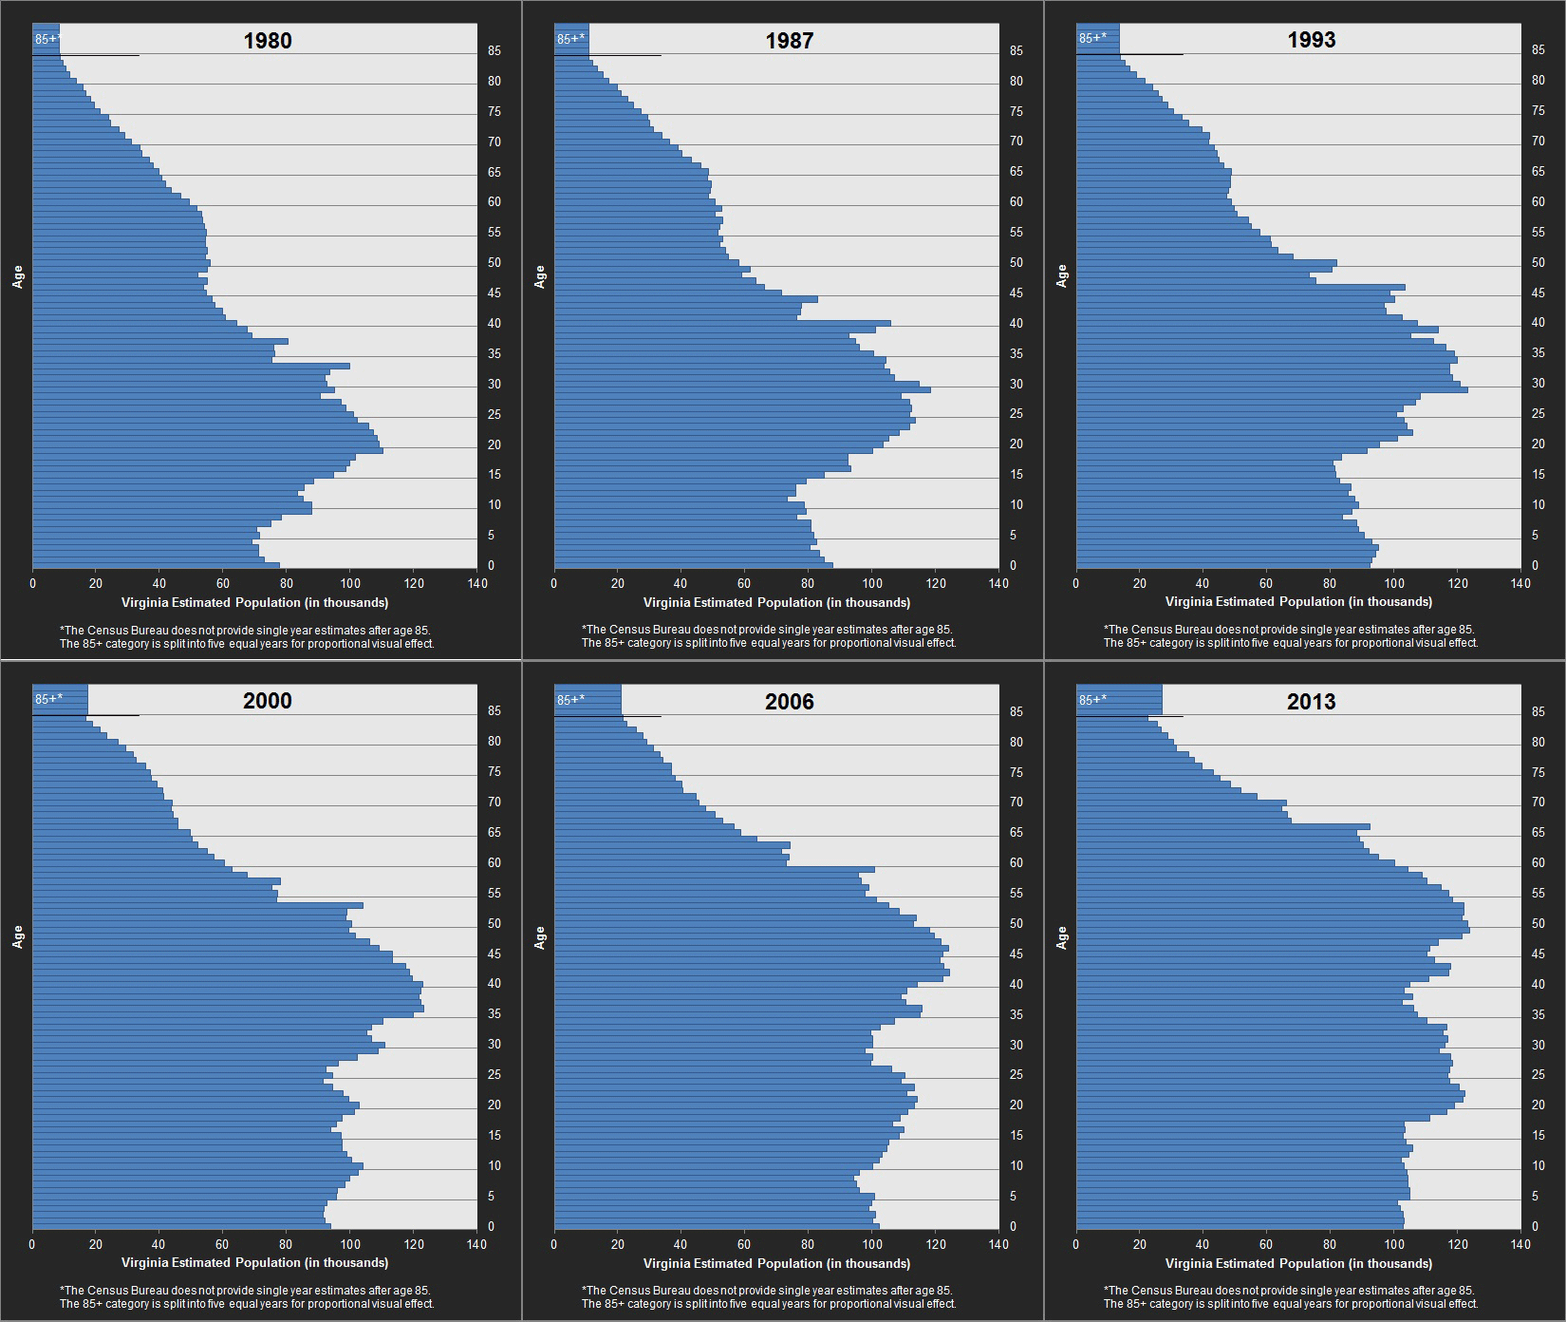
Why are counties with such low birth rates still growing? Virginia as a whole has a birth rate as low as China’s, but both places continue to grow because they have even lower death rates. Rising life expectancies caused death rates to decline faster than birth rates during the 20th century. And because of longer life expectancies and low birth rates, most of Virginia and China’s population growth has been concentrated in age groups over 40, as illustrated in the graphic below.
As these larger cohorts have begun to approach life expectancy in recent years, death rates have started to rise again. Increasingly in Virginia, localities’ birth rates are not high enough to compensate for rising death rates. China’s population is expected to begin declining within 15 years because of this. Virginia’s population, however, is not likely to decline anytime soon, provided it continues to attract enough people from other states and countries. On the locality level, growth may be less reliable and even more dependent on migration.

A couple notes on the map:
Many people are familiar with fertility rates being displayed as births per woman, but that calculation requires a normal age structure, which many of Virginia’s localities are too small to have. So I used the crude birth rate of annual births per thousand residents instead, which is more applicable.
Some countries match multiple localities, the reason for this is that there are 133 localities in Virginia and not as many countries with low birth rates.


