


Single-year vs. Multiyear ACS estimates

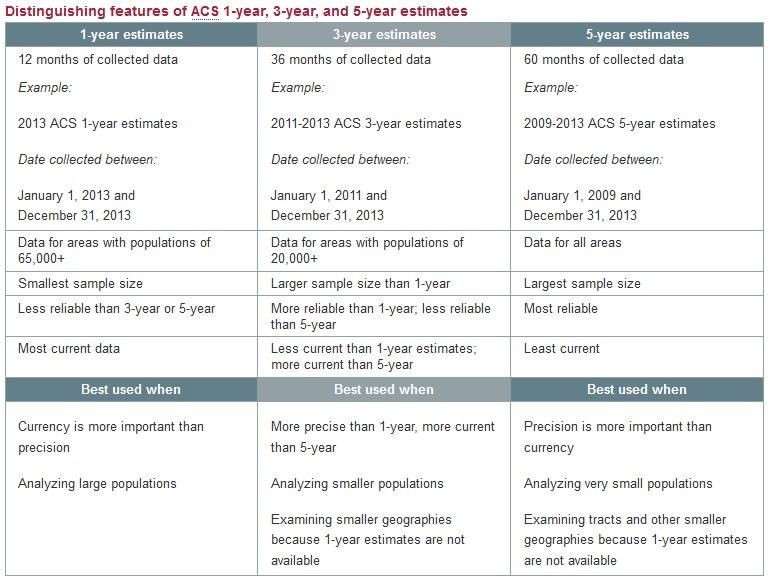
A couple of weeks back, I attended the 2015 ACS Data Users Conference and heard a lot of concerned researchers discussing the impact of losing the 3-year estimates from the American Community Survey. In the past, the Census Bureau provided separate 1-year, 3-year, and 5-year estimates – but funding constraints have resulted in the discontinuation of the 3-year statistical product which covered communities with a population size of 20,000 or more. Each set of estimates have their relative merits, as explained in detail on their website. The 3 and 5-year estimates are period estimates constructed as a rolling average, these are different from the 1-year values which capture the data collected during the annual cycle. Choice of the data-set and the timeline depends on the goal of the analysis, and it usually involves some tradeoff between currency and precision.
I was aware that the 3-year data product would be discontinued, but was not really sure how it would impact me and my work – I typically make my choice depending on the size of the geography and try to use the most recent data available. In fact, I realized that I had never run a comparative analysis of the estimates from the alternate timelines on the ACS. Examining the basic demographic variables for Virginia makes it clear that the 1-year (just 2012), 3-year (2010-2012), and 5-year estimates (2008-2012) are quite different, and the margins of error are inversely correlated with the time interval.
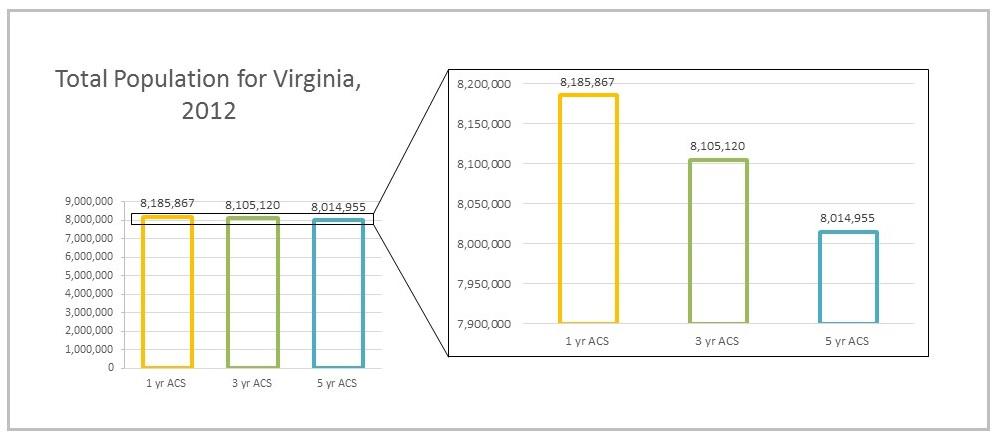
For instance, look at the total population of Virginia for 2012, which ranges from 8,185,867 people on the 1-year estimate to 8,014,955 people as per the 5-year rolling average. While the difference is not much as a share of the 8-million residents in the Commonwealth, a surplus or deficit of nearly 200,000 people is a considerable margin, especially when we use these numbers for data analysis or decision making. This is where the 3-year population total serves as a middle ground between the other two estimates.
For most of the other variables, the data points seem balanced and more consistent in terms of percentages but the actual population numbers are quite spread out. This makes the percentages, instead of the absolute numbers, the most useful feature and they serve as a major strength of the ACS multiyear estimates. Also since the difference between the percentage measures for the 1, 3, and 5-year estimates are so small, it makes sacrificing the 3-year estimate slightly more bearable when faced with the tighter budget. Finally, notice that the margins of error (black lines at the end of each bar) are also usually smallest for the 5-year estimate, making them the most reliable.
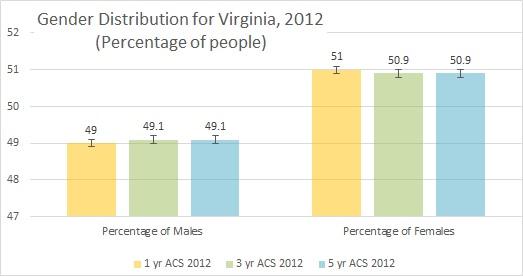

The comparison of the different estimates for distribution of males and females in Virginia is illustrated in the graphs above. The numbers for age, race and ethnicity fluctuate a little more over the different timelines, as there are more subcategories for each variable.
The 3-year estimates covered areas with medium sized populations between 20,000 and 65,000 people and larger areas with population above 65,000. With its discontinuation, the Census Bureau will keep producing ACS estimates annually for communities of 65,000+ people and the five year rolling averages will also be updated for all communities across the nation. So we still have access to representative data for the country, but just fewer options to choose from.